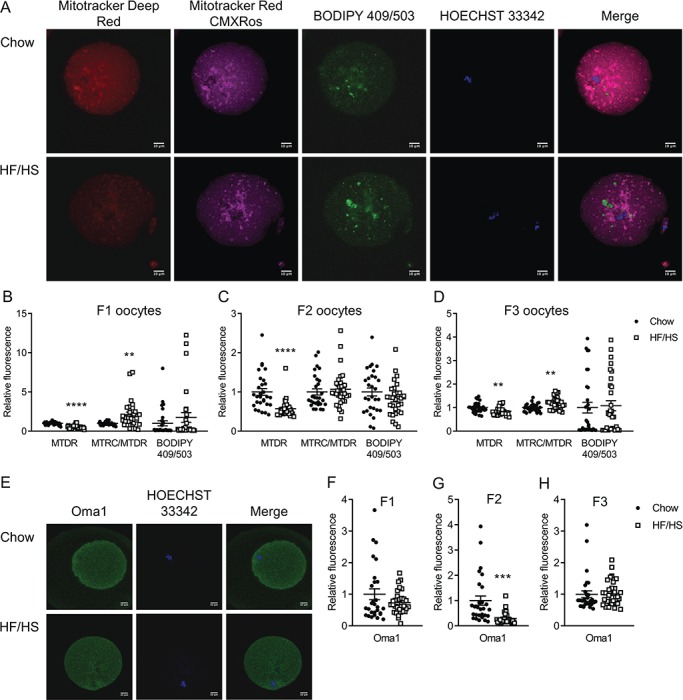
Figure 1.

Effect of F0 diet on mitochondrial mass and membrane potential and Oma1 protein expression in offspring oocytes. (A and E) Representative images of oocytes derived from chow and HF/HS groups. Quantification of mitochondrial mass (MTDR), mitochondrial membrane potential (MTRC/MTDR) and lipid droplets (BODIPY 409/503) in oocytes derived from F1 (B), F2 (C) and F3 (D) generations (n = 29–30 oocytes derived from five mice/diet/generation). Quantification of Oma1 protein expression in F1 (F), F2 (G) and F3 (H) oocytes (n = 28–30 oocytes derived from five mice/diet/generation). Scale bar = 10 μm. Data are represented as mean ± SEM. **P < 0.01, ***P < 0.001, ****P < 0.0001.
