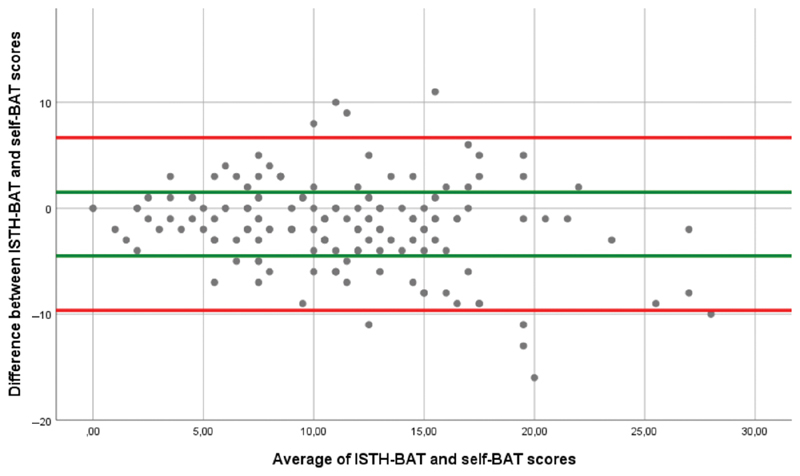
Fig. 2.

Bland–Altman plot of the differences between ISTH-BAT and self-BAT score versus the average of the two scores. Y-axis: difference in scores between self-BAT and ISTH-BAT; X-axis: average of the ISTH-BAT and self-BAT total score; limits of agreement (LoA) from study = red line, green line = ±3 from the average score which is the beforehand determined LoA: −9.65 to 6.67. ISTH-BAT, International Society for Thrombosis and Hemostasis–bleeding assessment tool; self-BAT, self-administered ISTH-BAT.
