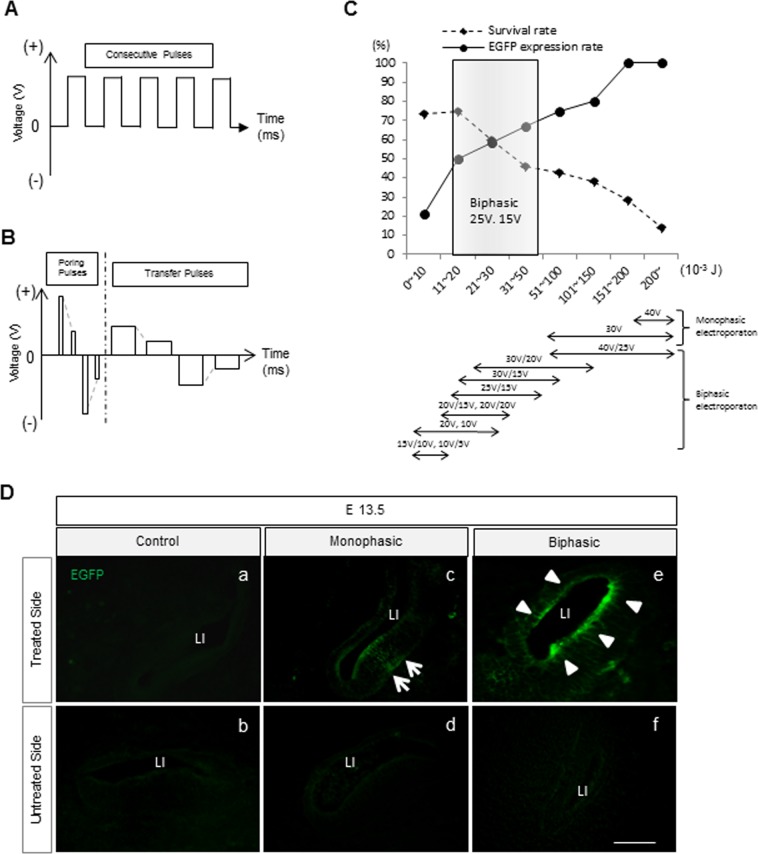
Figure 1.
Gene transfection methods via electroporation, in WT mice. (A) Schematic of the electroporation conditions of monophasic (M-) pulses. (B) Schematic of the electroporation conditions of biphasic (B-) pulses. (C) The graph shows survival and EGFP expression (number of animals who had EGFP expression in treated animals) rate of E 13.5 treated mice in M and B-treated mice. X-axis represents total energy (10−3 J) in different electroporation settings. (D) Sectional images at E 13.5 of control (a,b), M-treated group (c and d), and B-treated group (e and f). The arrows show unilateral EGFP expression of the treated cochlear epithelium in the M-treated group (c), and the arrowheads indicate EGFP expression of the whole treated cochlear epithelium in the B-treated group (e). Scale bar indicates 50 μm.

