Figure 2.
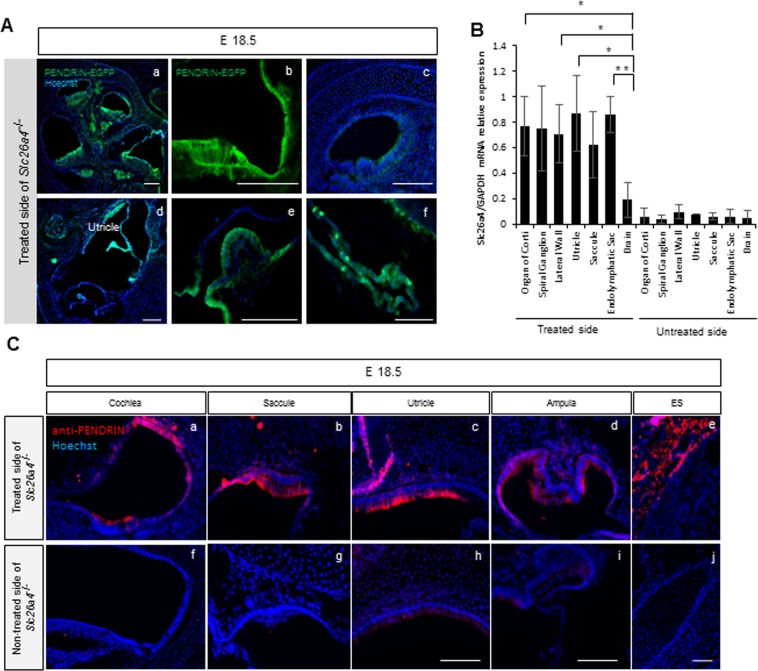
The results of histology and qPCR after treatment at E 18.5. (A) Images of the embryonic inner ear at E 18.5 in the treated side of Slc26a4−/− mice. PENDRIN-EGFP expression is detectable at the lateral wall in the cochlear middle turn (a,b), the utricle (d), the ampulla of semicircular canals (e) and the ES (f), while hardly in the cochlear apical turn (c). Green indicates PENDRIN-EGFP expression, and blue indicates nuclear (Hoechst) staining. Bars represent 100 μm. (B) Slc26a4 mRNA expression in each region of the inner ear by quantitative rtPCR from LMD. The bars represent mean Slc26a4 mRNA expression levels against GAPDH mRNA expression levels. n = 5. *P < 0.05. **P < 0.01 (Mann-Whitney U). (C) Immunohistochemistry of the embryonic inner ear at E 18.5 in the treated (a–e) and non-treated (f–j) sides of Slc26a4−/− mice utilizing anti-PENDRIN antibody. PENDRIN expression are seen widely in the cochlea (a), saccule (b), utricle (c), ampulla (d) and endolymphatic sac (ES) (e) in the treated side of Slc26a4−/− mice. There was no PENDRIN signal seen in the non-treated side of Slc26a4−/− mice. Red indicates PENDRIN expression and blue indicates nuclear (Hoechst) staining. Bars represent 50 μm.

