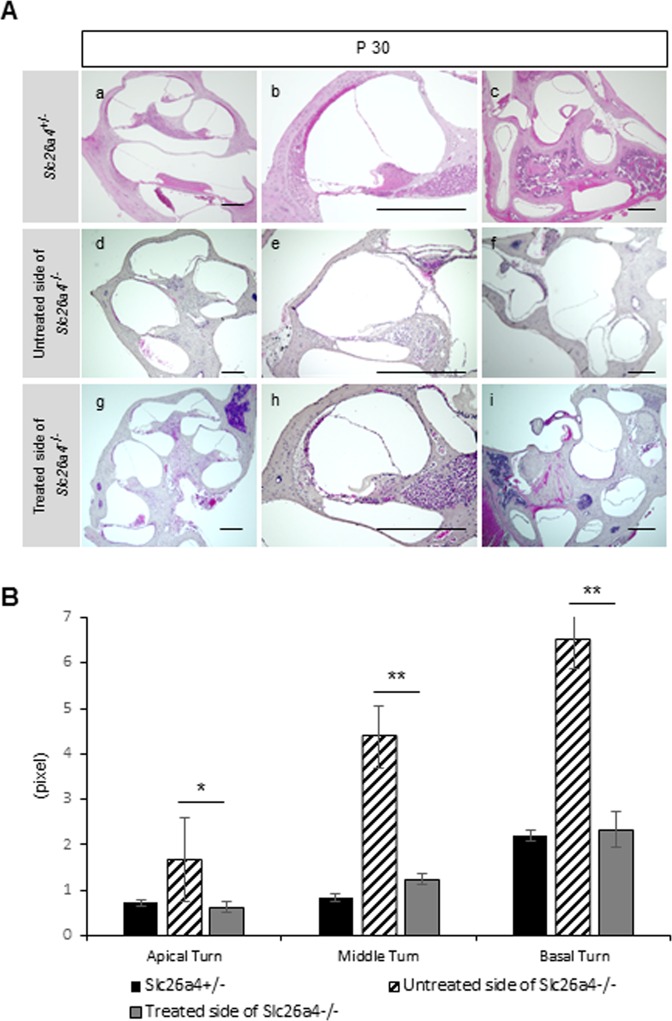
Figure 4.
Morphology (H&E staining) and areas of endolymphatic space in each cochlear turn at P 30. (A) Sectional images of the Slc26a4+/− mice (a–c), the untreated side of Slc26a4−/− mice (d-f) and the treated side of Slc26a4−/− mice (g–i) at P 30. The areas of endolymphatic space of the treated side of Slc26a4−/− are smaller than that of the untreated side of Slc26a4−/−. Scale bars represent 100 μm. (B) The graph shows the areas of endolymphatic space in each cochlear turn at P 30. Each area of three turns in the treated cochleae is significantly reduced when compared with that in the untreated side. n = 5. *P < 0.05. **P < 0.01 (Mann-Whitney U).

