Figure 5.
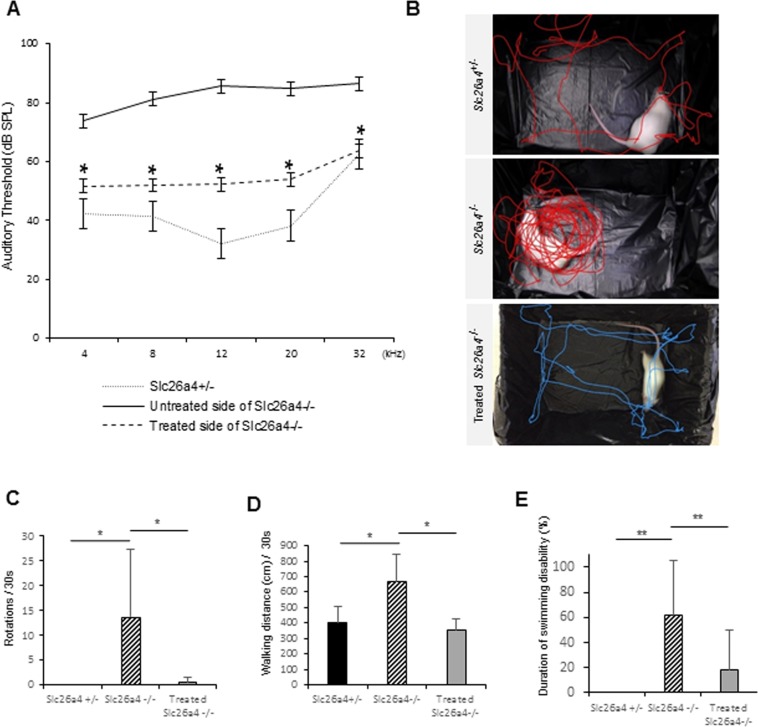
The results of auditory function tests and vestibular function tests at P 30. (A) ABR testing results. Statistically significant difference is found between the treated and the untreated sides in Slc26a4−/− mice at 4, 8, 12, 20 and 32 kHz. Each n = 5. *P < 0.05 (Mann-Whitney U). (B) Representative track plots for 15 seconds. The Slc26a4−/− mouse is severely circling, while Slc26a4+/− and treated Slc26a4−/− mice are not circling and walking almost normally. (C) This graph shows numbers of rotation per 30 seconds. n = 5. *P < 0.05 (Mann-Whitney U). (D) This graph shows walking distance per 30 seconds. n = 5. *P < 0.05 (Mann-Whitney U). (E) This graph shows duration of swimming disability. Statistically significant difference is found between the non-treated Slc26a4−/− mice and the treated Slc26a4−/− mice as for numbers of rotation, walking distance and duration of swimming disability. n = 5. *P < 0.05. **P < 0.01 (Mann-Whitney U).

