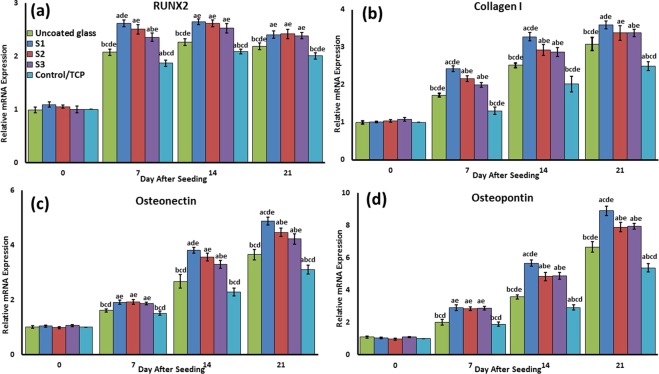
Figure 13.
The mRNA relative expression levels of osteogenic genes, included Runx2 (a), Collagen I (b), Osteonectin (c), and Osteopontin (d) were determined by qRT-PCR for all samples. a: statistically significant difference compared with uncoated group at p < 0.05; (b) statistically significant difference compared with S1 group at p < 0.05; (c) statistically significant difference compared with S2 group at P < 0.05. (d) Statistically significant difference compared with S3 group at p < 0.05; (e) statistically significant difference compared with TCP group at p < 0.05.

