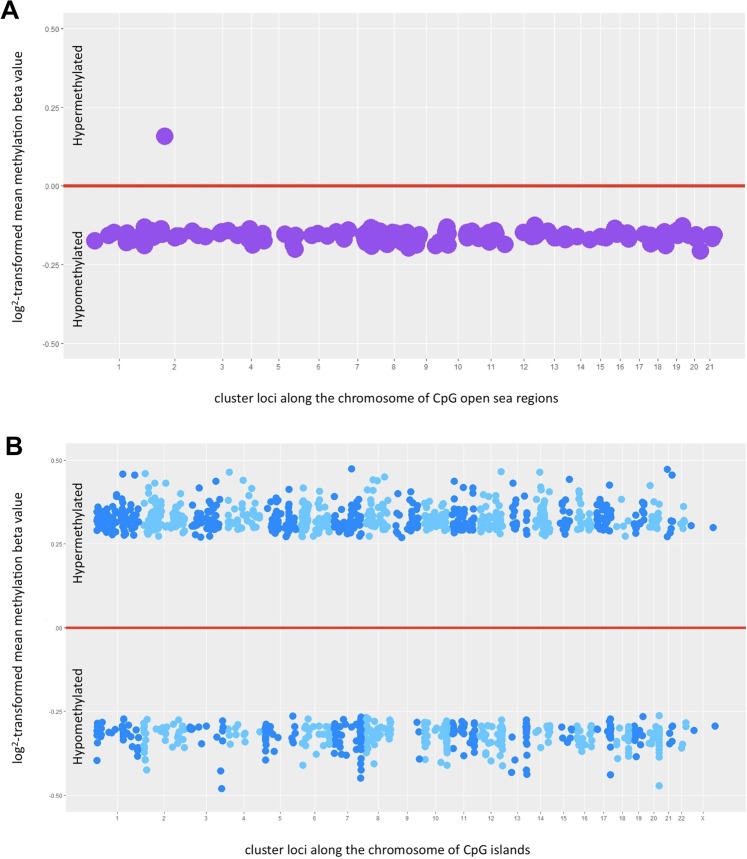
Figure 5.
Global methylation status and promoter methylation status in high-grade serous ovarian cancer. (A) Global methylation status was evaluated using probes that identify isolated loci of methylated CpGs in the open sea regions of the genome defined as >4 Kb away from the nearest CpG island. Each dot represents a cluster of long methylated DNA segments (B). Promoter methylation status was evaluated using probes that identify shorter genomic regions of CpGs. Each dot represents a cluster of contiguous CpG regions knows as CpG islands and/or shorelines. The alternating shades of color are used to differentiate a cluster located in one chromosome from another in a different chromosome. In (A,B) the numbers on the X- axis represent chromosomes. The dots appearing above the red line represent hypermethylated regions, while those appearing below are hypomethylated.

