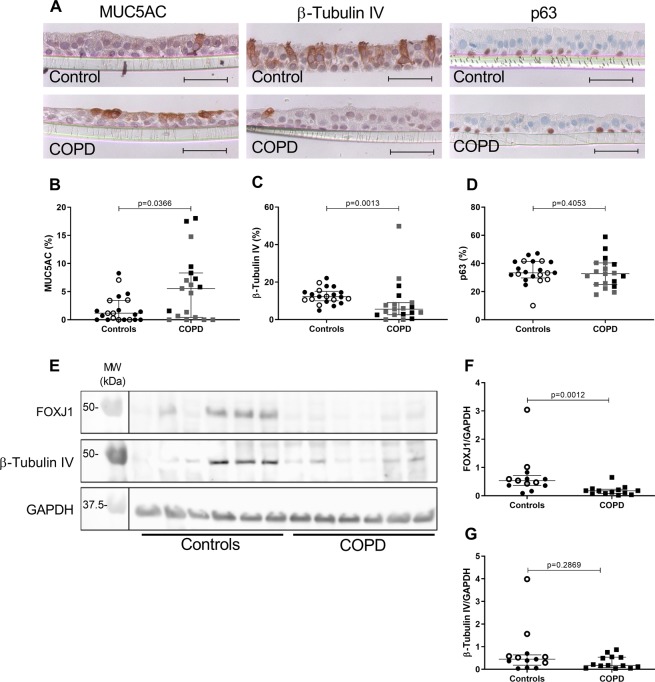
Figure 3.
Cell lineage immunophenotyping in ALI-HBEC. (A) IHC for MUC5AC (goblet cells), ß-tubulin IV (ciliated cells) and p63 (basal cells) in ALI-HBEC of a control and a COPD patient. (B) Quantification of MUC5AC staining in ALI-HBEC expressed in percentage of positive cells (n = 40). (C) Quantification of ß-tubulin IV staining in ALI-HBEC expressed in percentage of positive cells (n = 40). (D) Quantification of p63 staining in ALI-HBEC expressed in percentage of positive cells (n = 40). (E) Immunoblot for FOXJ1 (50 kDa), ß-tubulin IV (50 kDa) and GAPDH (37 kDa) expression in cellular lysates of ALI-HBEC from controls and COPD patients (n = 12). (F) Quantification of FOXJ1 protein, as referred to GAPDH in cellular lysates of ALI-HBEC from controls and COPD patients (n = 26). (G) Quantification of ß-tubulin IV protein, as referred to GAPDH in cellular lysates of ALI-HBEC from controls and COPD patients (n = 26). Scale bar, 50 µm. White dots represent non-smoker controls and black dots current smoker controls, grey squares represent mild and moderate COPD and black squares severe and very severe COPD. Mann-Whitney U test.

