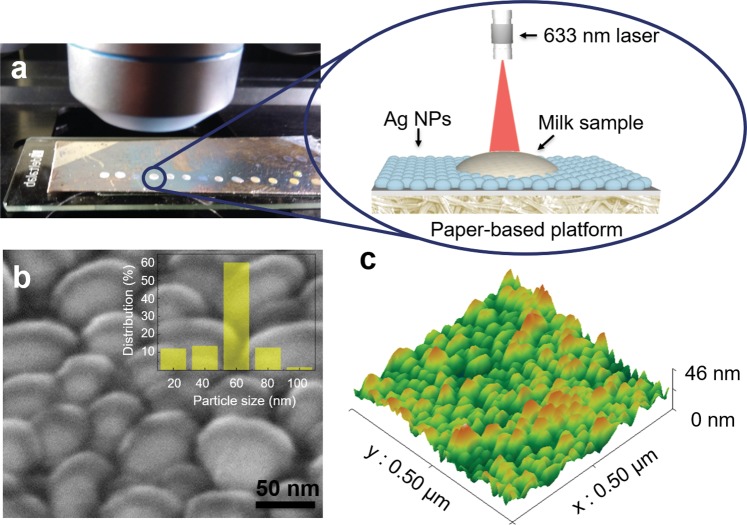
Figure 1.
Production and characterization of cardboard-Ag NPs SERS substrates. (a) Optical photograph of the Ag NPs-cardboard platform with milk spiked TET measurement set up. The zoom in represents a schematic representation of a single measurement. (b) SEM image of the Ag NPs on top of the cardboard substrate. The histogram for the size particle distribution is presented in the inset image. (c) AFM image showing the cardboard substrate with Ag NPs.

