
Figure 3.
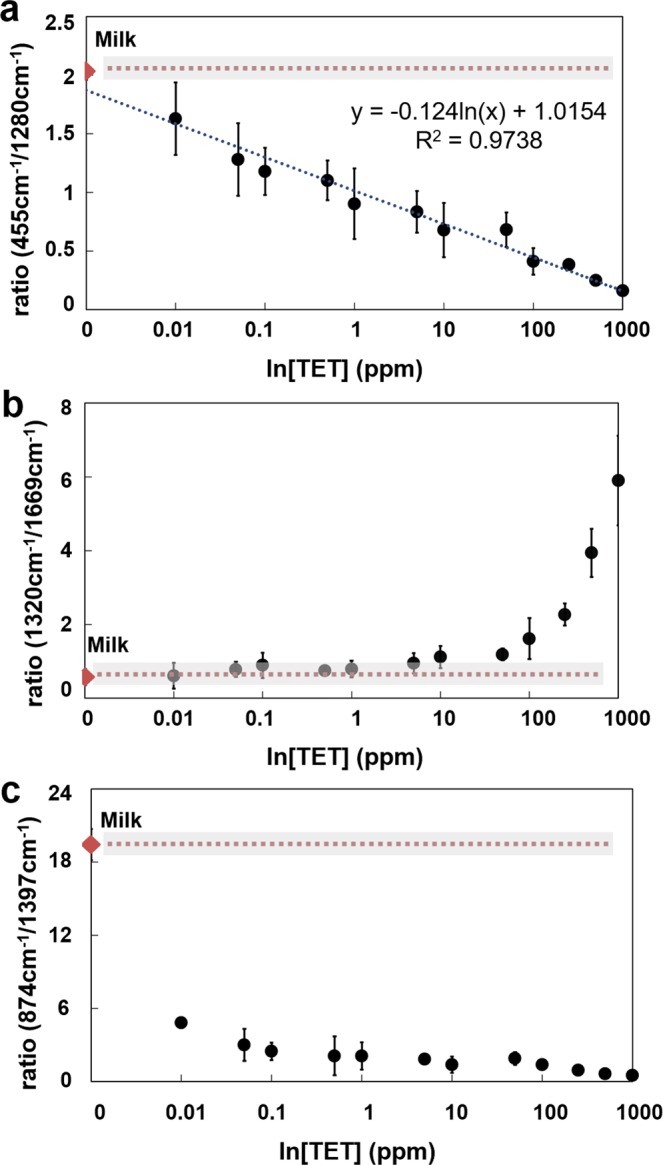
Dependence of SERS signal intensity ratio and TET concentration (n = 3). (a) Correlation between ratio 455 cm−1/1280 cm−1 versus analyte concentration in logarithmic scale. Linear correlation y = −0.124ln(x) + 1.0154; R2 = 0.9738). (b) Correlation between ratio 1320 cm−1/1669 cm−1 versus analyte concentration in logarithmic scale. (c) Correlation between ratio 874 cm−1/1397 cm−1 versus analyte concentration in logarithmic scale. Diamond marker shows the ratio values obtained for milk samples without TET and grey shade the error (standard deviation). Each point in the final calibration curve corresponded to the mean value and the error bars to the standard deviation of three independent measurements.