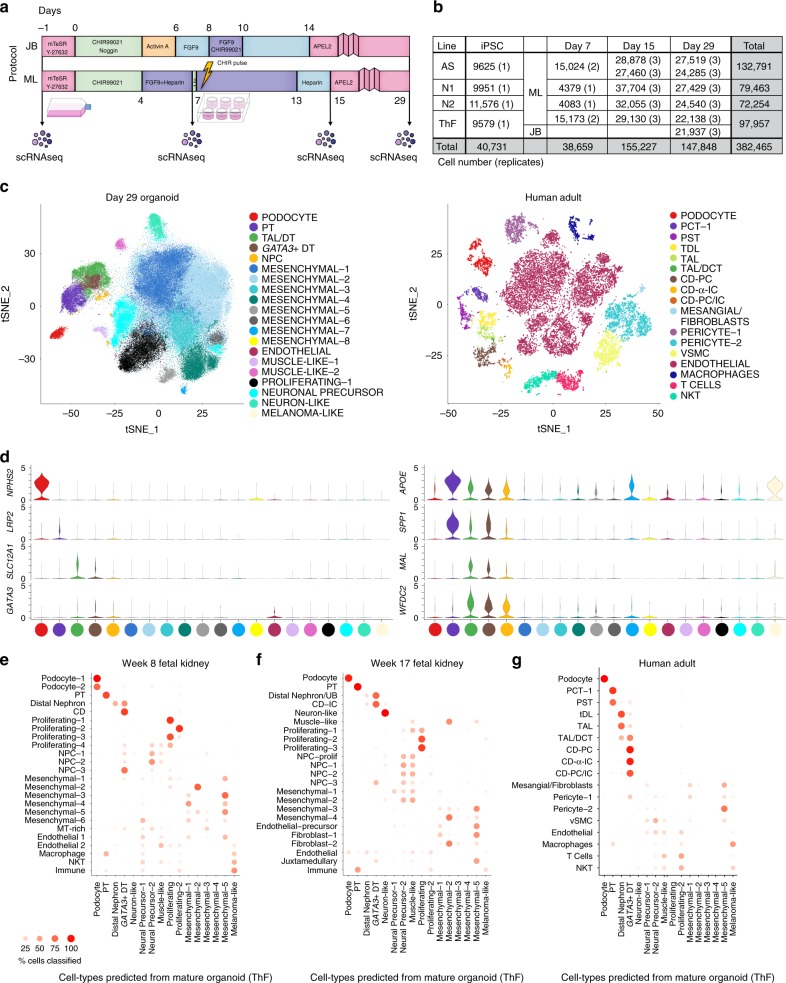
Fig. 1.
Mature kidney organoids from four different human iPSC lines contain major nephron cell classes. a Schematic of differentiation protocols for kidney organoids derived from human iPSCs by the JB and ML protocols (methods). Single-cell sequencing time-points as shown. b Table summarizing single cells profiled across four different human iPSC cell lines (AS, N1, N2, ThF) using two different protocols (ML, JB) across four time points (iPSC, Day 7 (D7), 15 (D15) and 29 (D29)). Replicates are indicated in parentheses. c t-SNE plot of composite single-cell transcriptomic profiles from all four iPSC D29 kidney organoids (left) and human adult kidney (right). Cluster color annotations as shown. d (left) Violin plots showing expression of canonical adult human kidney markers used to identify nephron clusters in D29 organoids: podocyte (NPHS2), proximal tubule (PT; LRP2), thick ascending limb/distal nephron (TAL; SLC12A1) and immature distal nephron (GATA3 + DT). Mesenchymal and off-target cells were also detected. (right) Violin plots of data-derived tubular markers revealed proximal to distal gradient of APOE expression, proximal marker SPP1, and distal markers WFDC2 and MAL. e Random forest classifier trained on D29 ML_ThF organoid gene expression profiles accurately predicted respective nephron cell classes in human first and second trimester fetal kidney (e, f) as compared to adult kidney (g). The Y-axis labels in each panel represent the annotated cell class in each human sample. The X-axis labels are predicted cell classes at D29 (ML_ThF organoids). The size and intensity of the red dot represents the % of cells in the Y-axis cell-types classified as the corresponding X-axis cell-class, e.g., all human adult podocytes are correctly classified as podocytes, while distal convoluted tubule (DCT) is predicted to be most similar to the GATA3 + DT organoid cell class.

