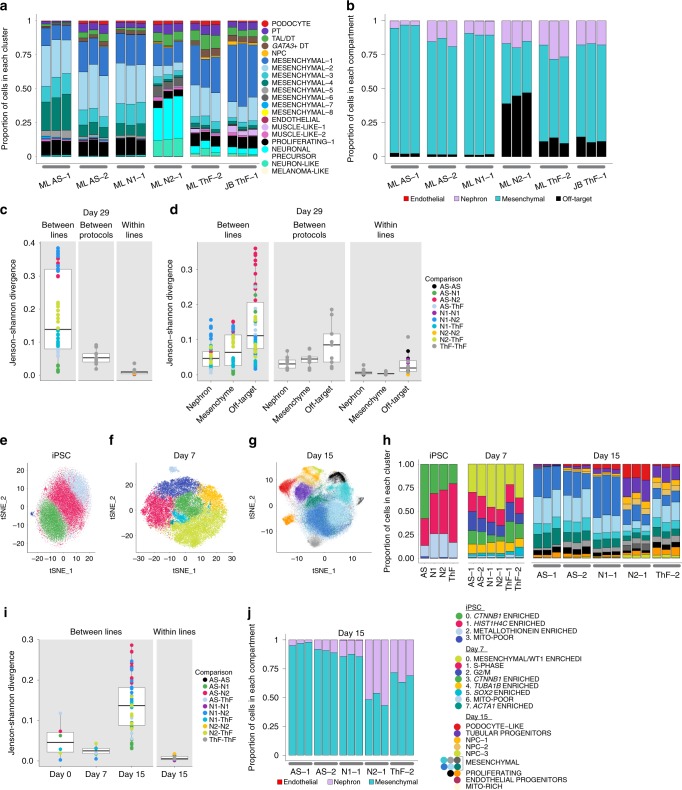
Fig. 3.
Variability in cell type proportions detected by scRNA-seq evident at D15. a, b Relative proportions of endothelial, nephron, mesenchymal and off-target cell clusters across all replicates of D29 organoids. Annotations as shown. c, d Comparison of cell-type composition between D29 organoids as determined by boxplots of the Jenson−Shannon Divergence (JSD) scores. Each point on the plot is a pair-wise (color) measure of JSD between two organoids. Legend indicates annotation for pairs of iPSC lines. The center line of the boxplots indicates the median, and the bottom and top lines of the box indicate the first and third quartiles respectively of the JSD scores. Outliers are indicated as dots beyond the whiskers; whiskers stretch up to +−1.5*IQR on both sides. c Organoid compositional differences are greater between lines than between different protocols for the same line or between replicates of the same line and protocol (within lines). d Organoid compositional heterogeneity is greatest in the off-target compartment followed by the mesenchyme and the nephron compartment in all three comparison groups (between lines, between protocols and within lines). t-SNE plot of single cells from e iPSC, f D7, and g D15 of the organoid differentiation protocol. h Comparison of relative cell type proportion across iPSC lines of cell clusters shown in (e−g). i Compositional differences are greatest between lines at D15 and the least at D7. j Compartment-specific cell-type proportions at D15 across all lines and replicates.

