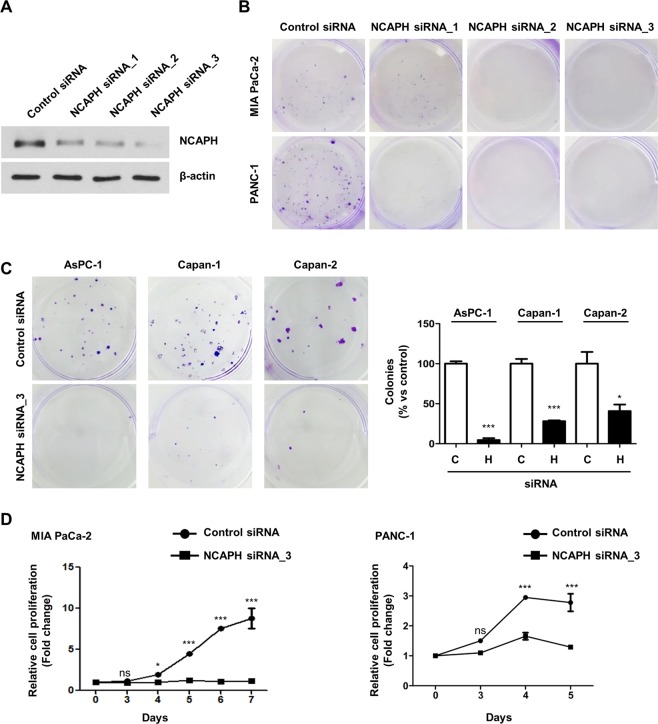
Figure 2.
Effects of NCAPH on colony formation ability and proliferation of PC cells. (A) MIA PaCa-2 cells were transfected with three different siRNA constructs to knockdown NCAPH expression, and the expression levels of NCAPH protein were measured 48 h later by western blotting. Cell lysates were immunoblotted with the indicated antibodies. (B) Colony formation assays were performed on MIA PaCa-2 and PANC-1 cells transfected with the control and three different NCAPH siRNAs (NCAPH siRNA_1, siRNA_2, and siRNA _3). (C) Colony formation assays were performed in AsPC-1, Capan-1, and Capan-2 cells with control siRNA and NCAPH siRNA_3. The colonies were imaged and counted. Values represent means ± SEMs. Statistical analysis was performed using unpaired t-tests. ***P < 0.0001. (D) MTT assays were performed to determine proliferation of control and NCAPH-knockdown PC cells for 5 or 7 days. The curve was based on biological triplicates with values expressed as means ± SEMs. *P < 0.005, ***P < 0.0001. Statistical analysis was performed using two-way analysis of variance with Bonferroni’s multiple comparison tests.

