Figure 3.
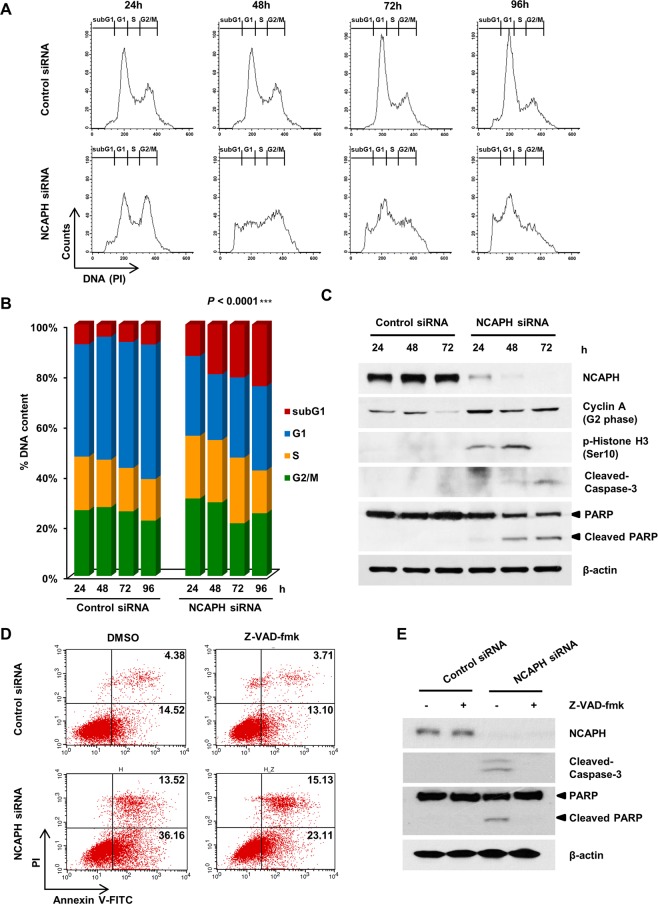
Knockdown of NCAPH induces S and G2/M phase arrest and apoptosis. (A) MIA PaCa-2 cells were transfected with control siRNA and NCAPH siRNA and then subjected to flow cytometric analysis at 24, 48, 72 and 96 h. The flow cytometry plots and data are representative of at least three separate experiments. (B) Bar graph showing the percentages of cells in sub-G1 (apoptosis, red), G1 (blue), S (orange), and G2/M (green) phases. The experiments were repeated three times, and mean values of the results are presented. ***P < 0.0001, two-way analysis of variance. (C) Western blot analysis was used to determine the levels of NCAPH, cyclin A, phospho-histone H3, caspase-3, PARP, and β-actin in MIA PaCa-2 cells after transfection with control siRNA or NCAPH siRNA for 24, 48, and 72 h. Cell lysates were immunoblotted with the indicated antibodies. (D) Annexin V staining was performed to measure apoptosis using flow cytometry. Z-VAD-Fmk (20 μM) was treated with cells for 24 h. LL (lower left) represents live, LR (lower right) represents early-apoptotic cells, UR (upper right) represents late stage apoptotic cells. (E) Western blot analysis was used to determine the levels of NCAPH, caspase-3, PARP, and β-actin in MIA PaCa-2 cells after transfection with control siRNA or NCAPH siRNA. Cells were treated with Z-VAD-Fmk (20 μM) for 24 h.

