Figure 5.
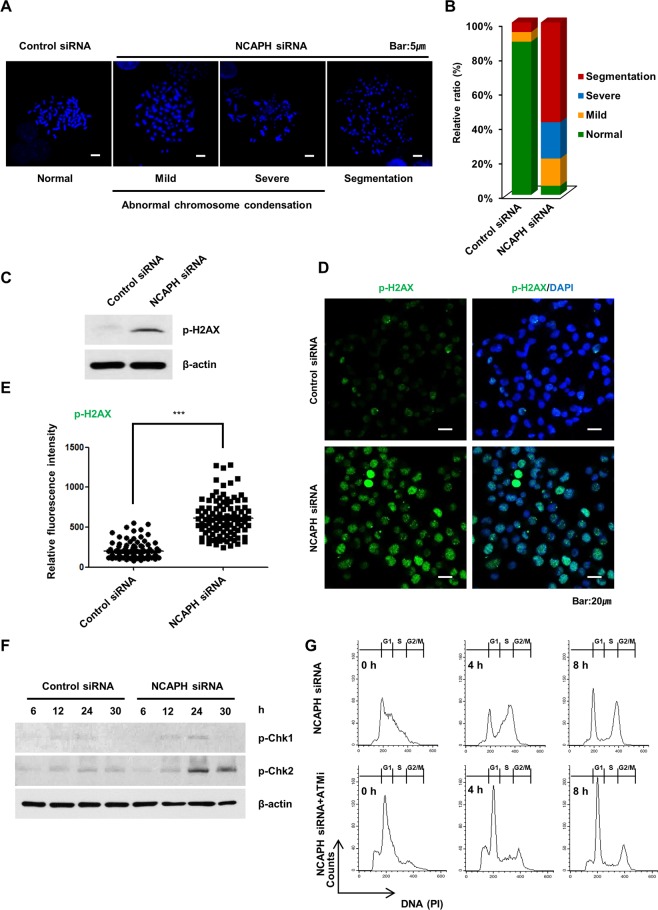
Knockdown of NCAPH induces chromosomal aberrations and DNA damage. (A,B) To confirm the chromosome morphology, MIA PaCa-2 cells were transfected with control siRNA or NCAPH siRNA and arrested at metaphase by colcemid treatment for 4 h. The cells were spread onto slides, extracted, fixed, and stained with DAPI (blue). For accurate quantification, more than 50 cells captured in at three different fields were analyzed. Scale bar, 5 µm. (C) Western blot analysis of phospho-H2AX expression in control and NCAPH-knockdown cells. Cell lysates were immunoblotted with the indicated antibodies. (D) Phospho-H2AX fluorescence pattern (green) in control and NCAPH-knockdown cells was observed by confocal microscopy. DNA was stained using DAPI (blue). Scale bar, 20 µm. (E) Frequency of phospho-H2AX fluorescence intensity. For accurate quantification, more than 100 cells captured in at least two different fields were analyzed. Values represent means ± SEMs. ***P < 0.0001, two-way analysis of variance. (F) Western blot analysis showing levels of phospho-Chk1 and phospho-Chk2 activation in response to DNA damage in MIA PaCa-2 cells after transfection with control siRNA and NCAPH siRNA for 6, 12, 24, and 30 h. (G) Cells were harvested for PI staining and analyzed by flow cytometry to determine the cell cycle fraction after release from the second thymidine block at 0, 4, and 8 h. ATMi (13 μM) was treated with a second thymidine block.

