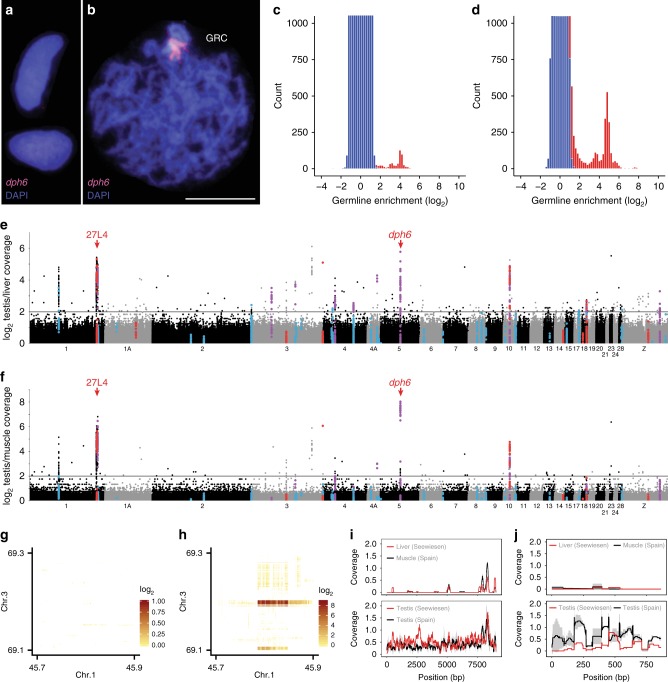
Fig. 1.
The zebra finch germline-restricted chromosome contains genes copied from many A chromosomes. a, b Cytogenetic evidence for GRC absence in muscle a and GRC presence in the testis b of the same bird (Spain_1) using fluorescence in-situ hybridisation (FISH) of our new GRC-amplified probe dph6 (selected due its high germline/soma coverage ratio; cf. e, f). Note that the single-copy A-chromosomal paralog of dph6 yields no visible FISH signal, unlike the estimated 308 dph6 copies on the GRC. The scale bar indicates 10 μm. c, d Comparison of germline/soma coverage ratios for 1 kb windows with an expected symmetrical distribution (blue bars) indicates enrichment of A-chromosomal single-copy regions in the germline (red bars), similar to lamprey2, both in Seewiesen (c; linked reads) and Spain (d; average of Spain_1 and Spain_2 coverage; PCR-free short reads) samples. Y-axis is truncated for visualisation. e, f Manhattan plot of germline/soma coverage ratios in 1 kb windows across chromosomes of the somatic reference genome taeGut2. Colours indicate high-confidence GRC-linked genes and their identification (red: coverage, blue: SNVs, purple: both; Supplementary Table 5). Note that the similarities between Seewiesen e and Spain_1/Spain_2 averages f constitute independent biological replicates for GRC-amplified regions, as the data are based on different domesticated populations and different library preparation methods. Red arrows denote two FISH-verified GRC-amplified regions (cf. b)8. Only chromosomes >5 Mb are shown for clarity. g, h Linked-read barcode interaction heatmaps of an inter-chromosomal rearrangement on the GRC absent in Seewiesen liver g but present in Seewiesen testis h. i, j Coverage plots of two examples of GRC-linked genes that are divergent from their A-chromosomal paralog, trim71 i and napa j10, and thus have very low coverage (normalised by total reads and genome size) in soma.

