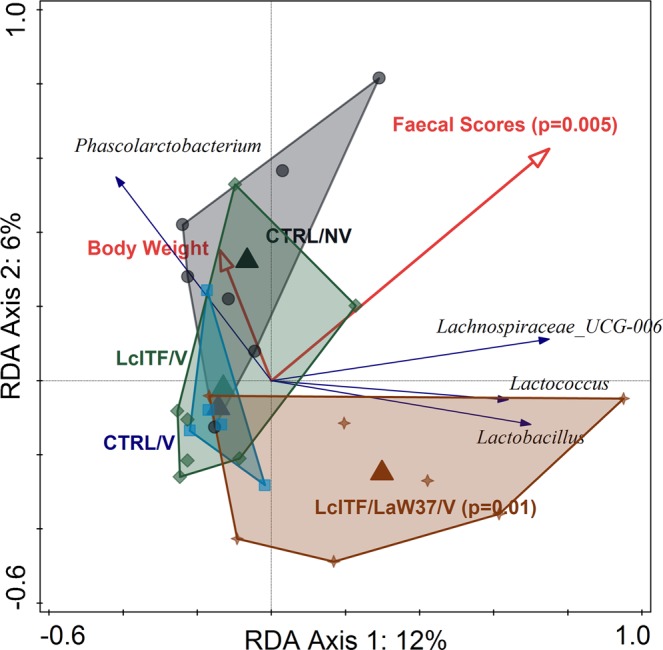
Figure 3.

RDA triplot showing the associations between the faecal microbiota composition and environmental variables on day 30. Triangles represent different experimental groups, red arrows numerical environmental variables and blue arrows the 4 best fitting bacterial genera on d30. The plotted first and second ordination axes explain 12% and 6% of the variability in the dataset. Samples are coloured by treatment CTRL = placebo control; NV = non-vaccinated; V = vaccinated; lcITF = long-chain inulin type fructans; LaW37 = L. acidophilus W37.
