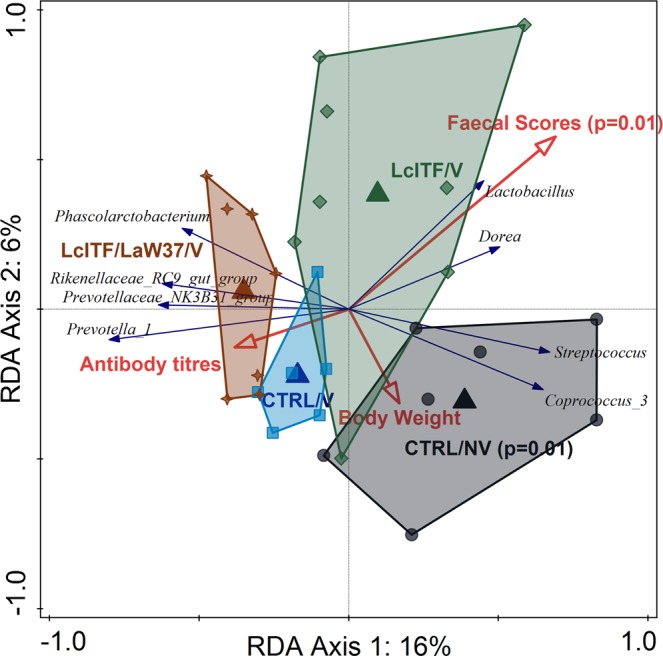
Figure 5.

Effect of STM challenge on faecal microbiota composition was different depending on the treatments. (A) RDA triplot showing the association between microbiota and environmental variables using samples from day 55, post STM challenge. Triangles represent different experimental groups, red arrows numerical environmental variables and blue arrows the 8 best fitting bacteria. The plotted first and second axes explain 16% and 6% of the variation in the dataset. Samples are coloured by treatment CTRL = placebo control; NV = non-vaccinated; V = vaccinated; lcITF = long-chain inulin type fructans; LaW37 = L. acidophilus W37.
