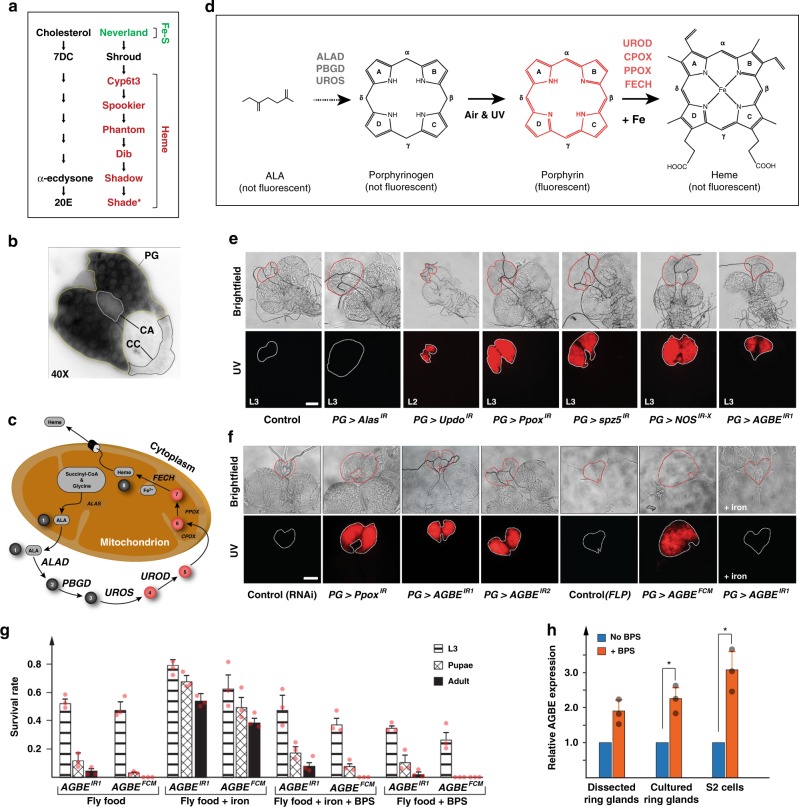
Fig. 1.
Disruption of haem biosynthesis in the Drosophila prothoracic gland (PG). a Ecdysone biosynthetic pathway converts cholesterol to α-ecdysone, which is metabolized to 20OH-ecdysone in target cells by Shade (*not or lowly expressed in the PG). All enzymes except for Shroud require iron co-factors in the form of iron–sulfur (Fe–S) clusters or haem. b Stain for ferric (non-haem-bound) iron in the ring gland. The corpus allatum (CA) and the corpora cardiaca (CC) are neighbouring glands fused to the PG. c Haem biosynthesis pathway in metazoans and yeast. Red circles represent protoporphyrin intermediates that autofluoresce. d Autofluorescence of porphyrins occurs through isomerization of porphyrinogens exposed to air and UV light. e UV exposure of dissected ring glands from RNAi lines (designated as geneIR) from second (L2) or third (L3) instar stages. Alas, Updo, and Ppox encode haem-synthesizing enzymes. spz5: spaetzle5, Nos: nitric oxide synthase, AGBE: 1,4-Alpha-Glucan Branching Enzyme. Scale bar = 250 μm. f UV exposure of dissected ring glands isolated at 40 h after the L2/L3 moult (~8 h prior to pupariation in controls). RNAi lines AGBEIR1 and AGBEIR2 target distinct regions of the AGBE mRNA. AGBEFCM is a conditional CRISPR-knock-in allele that can be excised in a tissue-specific manner via the expression of Flippase (FLP) recombinase (Supplementary Fig. 4). + iron: larvae were reared on a diet containing ferric ammonium citrate (FAC) as an iron supplement. Scale bar = 250 μm. g Survival of AGBEIR1 and AGBEFCM larvae fly food supplemented with iron (FAC) or an iron chelator, bathophenanthroline sulfate (BPS). Error bars represent standard deviation. Three biological replicates, with each sample containing 50 individuals. h Relative AGBE mRNA expression levels. Dissected ring glands: isolated from L3 reared on media ± BPS. Cultured ring glands: isolated from L3 reared on normal media, but then transferred to buffer containing ± BPS. S2 cells: Schneider 2 cells grown on medium ± BPS. mRNA levels were analysed via quantitative real-time PCR. For primers see Table 3. Asterisk indicates a P-value < 0.05 based on the Student’s t test. Error bars represent 95% confidence intervals. Each of the three biological replicates was tested three times. Source data are provided as a Source Data file.

