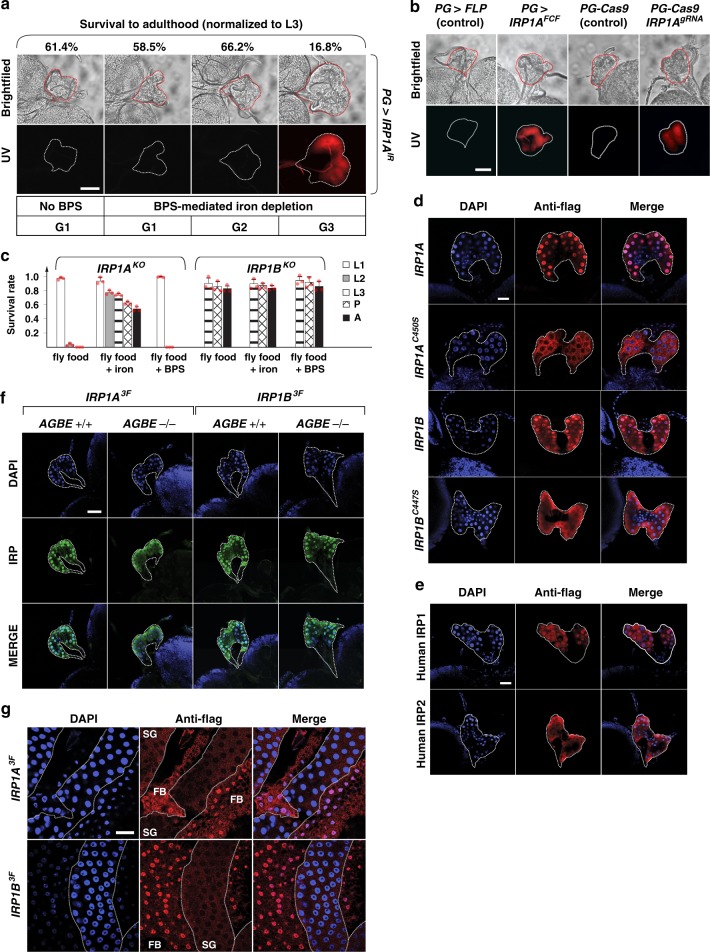
Fig. 3.
IRP1 localizes to nuclei. a Protoporphyrin accumulation/autofluorescence in prothoracic glands (PG) from IRP1A-RNAi (IRP1AIR) flies reared on iron-depleted (=BPS) media for three generations. Adult survival relative to last larval stage (surviving third instar larvae = L3 = 100%). Scale bar = 250 μm. b Protoporphyrin accumulation/autofluorescence in PGs from IRP1AFCF animals (tissue-specific excision of IRP1A, Supplementary Fig. 4) reared on iron-rich medium until L2, after which larvae were switched to BPS-supplemented food. Scale bar = 250 μm. c Survival of IRP1A and IRP1B null mutants (KO = knockout, Supplementary Fig. 4). Error bars represent standard deviation from three biological replicates (each sample contained 50 individuals). d Subcellular localization of PG-specific, Flag-tagged IRP1A and IRP1B (PG > IRP1A/PG > IRP1B transgenic lines, Supplementary Table 1). DAPI was used to stain DNA/nuclei. Scale bar = 250 μm. e Subcellular localization of Flag-tagged transgenic human IRP1 and IRP2 (PG > hIRP1 and PG > hIRP2, Supplementary Table 1) expressed specifically in the PG. Scale bar = 250 μm. f Subcellular localization of Flag-tagged proteins encoded by IRP1A3F and IRP1B3F knock-in alleles (Supplementary Fig. 4) in control or AGBE mutant backgrounds (AGBE+/+ = PG > FLP. AGBE−/− = PG > FLP; AGBEFCM, Supplementary Fig. 4). Scale bar = 500 μm. g Subcellular localization of Flag-tagged proteins encoded by IRP1A3F and IRP1B3F knock-in alleles (Supplementary Fig. 4) in the fat body (FB) and salivary gland (SG). Scale bar = 500 μm. Source data are provided as a Source Data file.

