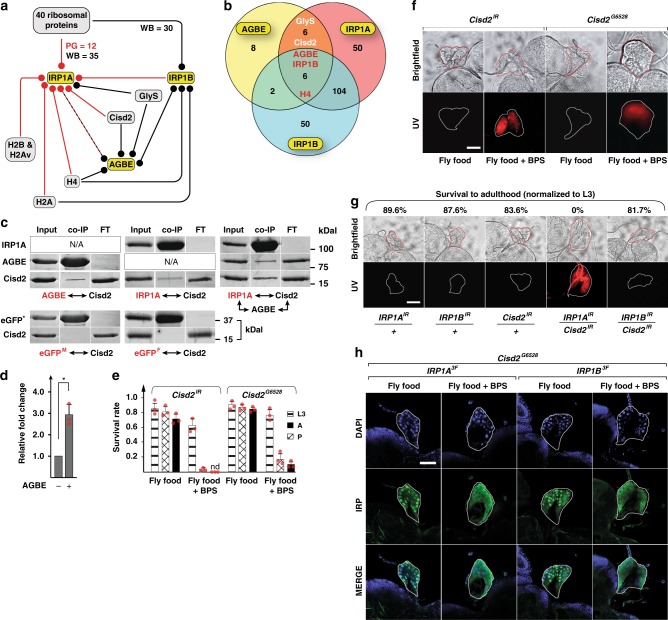
Fig. 4.
Cisd2 interacts with IRP1A and AGBE. a Protein–protein interaction map. Lines carrying knock-in alleles encoding Flag-tagged AGBE, IRP1A and IRP1B (yellow boxes, Supplementary Fig. 4) were used to produce bait (circle) for immunoprecipitation followed by mass spectrometry (MS) to identify physically bound proteins to the bait. Whole-body (WB, black) and prothoracic gland samples (PG) were used. Red: detected in both PG and WB samples. Dashed line: Only WB samples were tested for AGBE. H2Av, H2A, H2B and H4 are histone proteins. GlyS = Glycogen Synthase. b Venn diagram depicting overlaps of immunoprecipitated proteins from endogenously tagged proteins (WB samples). H4 & GlyS see A. c Co-transfection of Schneider 2 cells with plasmids encoding Myc-tagged AGBE, Flag-tagged IRP1A and HA-tagged Cisd2, followed by immunoprecipitation via anti-Myc or anti-Flag antibodies and Western blotting. Names shown in red indicate the protein used as bait. Myc-tagged and Flag-tagged enhanced GFP (eGFPM and eGFPF, respectively) served as negative controls. Presence of co-immunoprecipitated proteins were tested with anti-HA antibodies and anti-Myc antibodies. d Quantification of immunoprecipitated Cisd2 in the triple co-transfection experiment shown above in C. Graph shows relative fold change of co-immunoprecipitated Cisd2 with Flag-IRP1A as bait in the presence or absence of AGBE. Data was normalized to the amount of Cisd2 protein in the absence of co-transfected AGBE. The asterisk indicates a P-value < 0.05 according to the Student’s t test. Error bars represent standard deviation based on three biological replicates. e Survival rates of Cisd2IR-RNAi animals and Cisd2G6528 mutants on fly food ± BPS. nd = not detected. Error bars represent standard deviation from three biological replicates (each sample contained 50 individuals). f Autofluorescence/protoporphyrin accumulation in prothoracic glands (PG) of PG > Cisd2IR and Cisd2G6528 larvae reared on fly food ± BPS. Scale bar = 250 μm. g Genetic interaction between Cisd2 and IRP1A on regular (=iron-replete) fly food based on autofluorescening PGs and survival of the corresponding RNAi lines. All lines express RNAi via a PG-specific Gal4 driver (phm22-Gal4 = PG >). Scale bar = 250 μm. h. Subcellular localization of Flag-tagged IRP1A and IRP1B proteins expressed from knock-in alleles (Supplementary Table 1) in Cisd2G6528 mutants reared on fly food ± BPS. For control larvae, see Supplementary Fig. 10. Scale bar = 500 μm. Source data are provided as a Source Data file.

