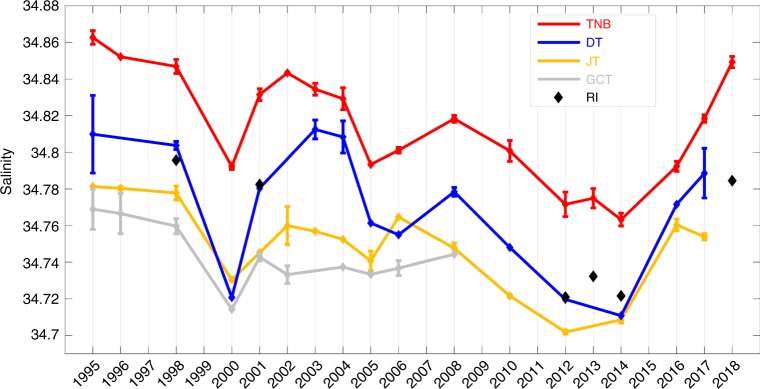
Fig. 2.
HSSW salinity time series (1995–2018) in the Ross Sea. Salinity averaged in the HSSW between 870 and 900 dbar in TNB (red line), between 850 and 880 dbar at RI (black diamonds), and in the deepest 20 dbar of the water column at DT (blue line), JT (amber line) and GCT (grey line). In each region, we have averaged CTD profiles on pressure surfaces to obtain a mean profile for each austral summer. The error bar is the mean standard deviation among all stations in the layer considered (see Methods) and is set equal to 0 in cases when only one profile was available in that year and region (see Supplementary Fig. 1 and Supplementary Table 1 for additional information on the number and location of CTD profiles used in each austral summer average).

