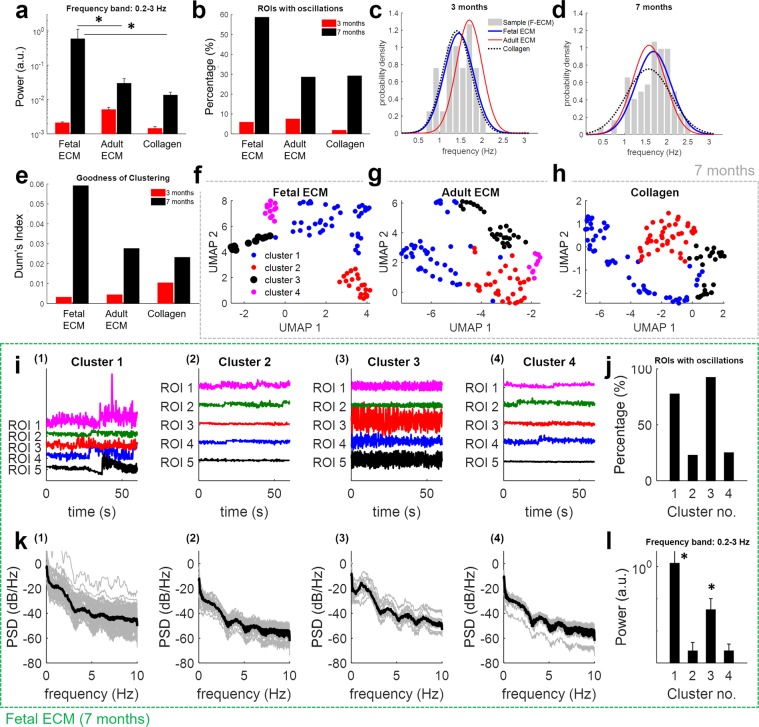
Figure 5.
Effects of ECM on spontaneous calcium activity in 3D cultures of differentiating human neural stem cells. Panels a–h) summarize the results of the spectral analysis and cluster analysis of the change in fluorescence ΔF/F for ROIs identified at 3 months and 7 months from constructs with fetal ECM, adult ECM, and Collagen I. Panel a) reports the power in the frequency band [0.2, 3] Hz for ΔF/F signals at 3 months (red bars) and 7 months (black bars). Values are mean ± S.E.M. across N ROIs. Values at 3 months: N = 341 (fetal ECM), 294 (adult ECM), 277 (Collagen I) from n = 3 cultures. Values at 7 months: N = 87 (fetal ECM), 112 (adult ECM), 120 (Collagen I) from n = 3 cultures. Asterisks denote significant difference between groups at 3 months versus 7 months and between groups with different ECM constructs (two-way ANOVA with Tukey’s post hoc test, P-value P < 0.01). Panel b) reports the percentage of ROIs at 3 months (red bars) and 7 months (black bars) whose ΔF/F time series exhibit significant oscillations for different types of ECM constructs. Percentages are calculated over N ROIs, with N as in panel a). Panel c,d) report the probability distribution function (PDF) of the frequency f of significant oscillations detected in ROIs from fetal ECM (blue lines), adult ECM (red lines), and Collagen I (dotted black lines) at 3 months (c) and 7 months (d). Each PDF is a Normal function fitted on the sample distribution of frequency f. Gray bars in (c,d) report the sample distribution of frequency f for ROIs from fetal ECM (F-ECM) constructs at 3 months and 7 months, respectively. Panel e) reports the Dunn’s index for the clustering performed on N ROIs at 3 months (red bars) and 7 months (black bars) from constructs with fetal ECM, adult ECM, and Collagen I. Values of N are as in panel a). Dunn’s index is computed on the UMAP components of the feature vectors. See Methods section for details. Panel f–h) report the UMAP plot of the ROIs from fetal ECM (f: N = 87), adult ECM (g: N = 112), and Collagen I (h: N = 120) constructs at 7 months colored by four clusters. Clustering was conducted separately for each construct. Panel i–l) recapitulate the behavior of spontaneous calcium activity from different clusters isolated at 7 months in constructs with fetal ECM. For cluster 1 through 4, Panel i) reports fluorescence signals ΔF/F from five sample ROIs from the cluster, while Panel k) reports the power spectrum density (PSD) of all ROIs in the cluster (gray lines, one line per ROI) and their median PSD (thick black line). Sub-panels (1), (2), (3), and (4) in (i–k) are for cluster 1, 2, 3, and 4, respectively. Number of ROIs per cluster are M = 40 (cluster 1), 22 (cluster 2), 13 (cluster 3), and 12 (cluster 4), respectively. Panel j) reports the percentage of ROIs in each cluster whose ΔF/F time series exhibit significant oscillations. Panel l) reports the power in the frequency band [0.2, 3] Hz for ΔF/F signals in each cluster. Values are mean ± S.E.M. across M ROIs, with M as in (i–k). Asterisks denote significant difference between clusters (one-way ANOVA with Tukey-Kramer post hoc test, P-value P < 0.01).

