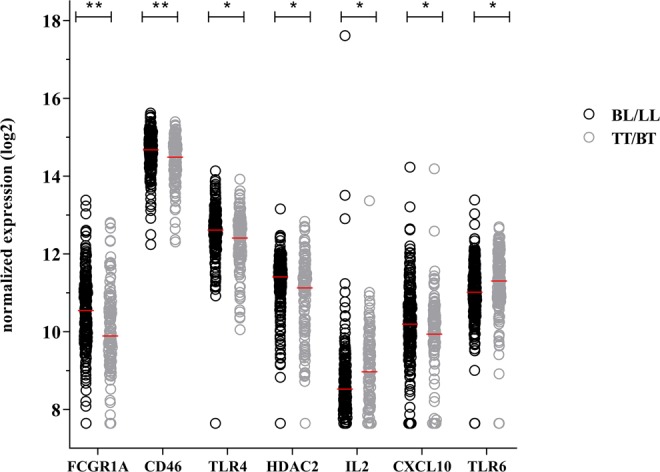
Figure 1.

Transcriptional profiles of BL/LL and TT/BT patients without reactions. Gene expression levels of 103 target genes were assessed by dual-color RT-MLPA performed on ex vivo RNA isolated from whole blood of newly diagnosed, untreated BL/LL (n = 228; black circles) and TT/BT (n = 131; grey circles) leprosy patients without reactions from Bangladesh, Brazil, Ethiopia and Nepal. Log2-transformations of peak areas (normalized to the housekeeping gene GAPDH) of genes that were significantly differentially expressed between BL/LL and TT/BT are shown on the y-axis. Raw p-values were calculated using the Mann–Whitney test and adjusted for multiple comparisons using the Benjamini-Hochberg correction40. *adjusted p-values < 0.05; **adjusted p-values < 0.01; (see Table S5).
