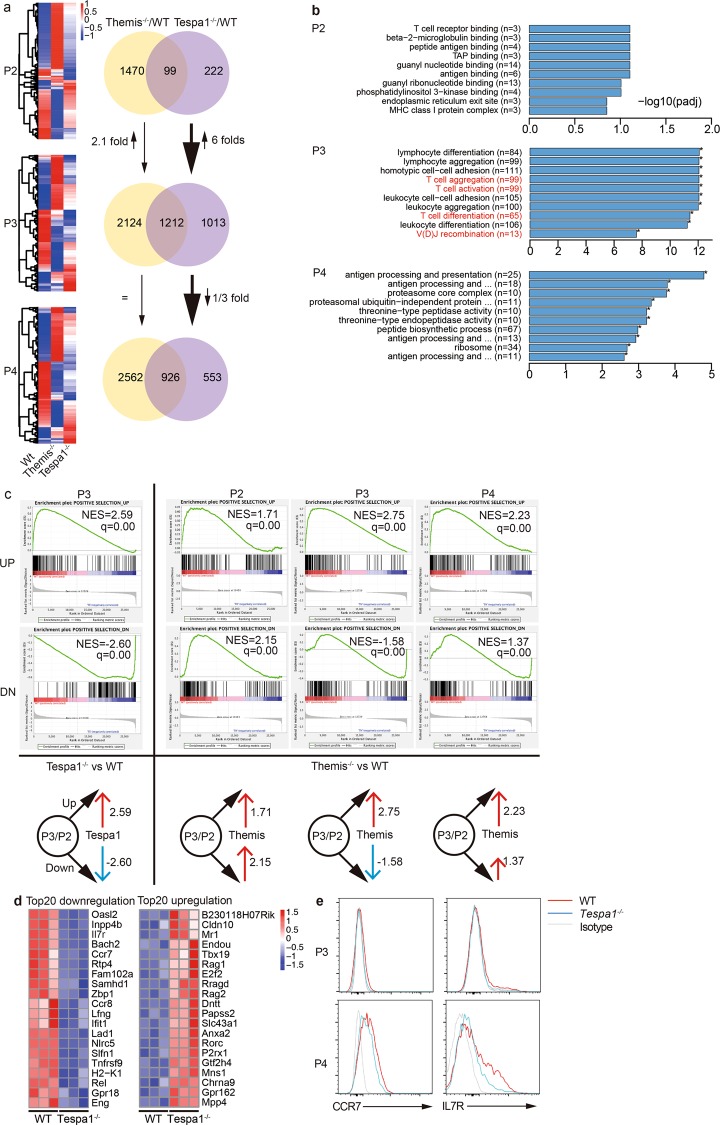
Fig. 1.
Differential transcriptional patterns in Themis (thymocyte expressed molecule involved in selection)- and Tespa1 (thymocyte expressed positive selection associated 1)-deficient thymocytes. a Heat maps (left) showing significantly changed gene expression (blue, low expression; red, high expression) in Themis−/− or Tespa1−/− thymocytes compared to that in wild-type (WT) thymocytes in the P2, P3, and P4 stages. The numbers in the Venn diagram (right) indicate genes with significantly changed expression only in Themis−/− (yellow) or Tespa1−/− (violet) thymocytes and genes with changed expression in both (overlap). b The top 10 GO enrichment terms most significantly associated with WT vs. Tespa1−/− cells in different stages. Gene ontogeny (GO) items in red text are related to T cell specific events. c Gene set enrichment analysis (GSEA) analysis: left, WT vs. Tespa1−/−; right, WT vs. Themis−/−. q specifies the adjusted p value. NES specifies normalized enrichment score. The diagrams below represent the relationship between the Tespa1/Themis and Positive gene sets. The black arrow denotes “Positive selection_UP” and “Positive selection_DN”. A red arrow denotes a positive correlation; a blue arrow denotes a negative correlation. The numbers denote the NES values. d Top 20 differentially expressed genes in Tespa1−/− thymocytes in the P3 stage. Left, the top 20 downregulated genes. Right, the top 20 upregulated genes. e Surface expression of CCR7 and IL7R in thymocytes in the P3 and P4 stages. The red line specifies WT; the blue line specifies Tespa1−/−; the gray line specifies the isotype. The samples used for sequencing were pooled from six WT, Themis−/−, and Tespa1−/− mice. Three biological replicates were sequenced

