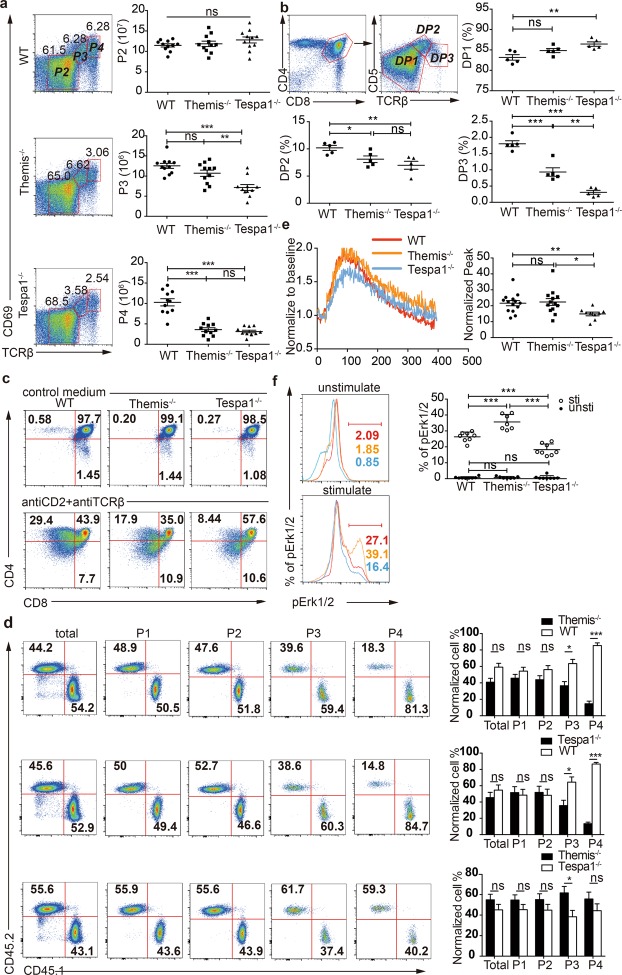
Fig. 2.
Impaired positive selection in Themis−/− (thymocyte expressed molecule involved in selection) and Tespa1−/− (thymocyte expressed positive selection associated 1) thymocytes. a Surface staining of CD69 and TCRβ in wild-type (WT), Themis−/−, and Tespa1−/− thymocytes. The numbers adjacent to the outlined areas indicate the cell percentages. Right, quantification of the P2, P3, and P4 thymocyte populations from WT, Themis−/−, and Tespa1−/− mice. b Surface staining of CD5 and TCRβ in WT, Themis−/−, and Tespa1−/− thymocytes gated on CD4+ and CD8+ double-positive populations. The numbers adjacent to the outlined areas indicate the cell percentages. Lower right, quantification of the DP1, DP2, and DP3 thymocyte populations from WT, Themis−/− and Tespa1−/− mice. c Staining of CD4 and CD8 in sorted DP thymocytes from WT, Themis−/−, and Tespa1−/− mice. Top row, unstimulated DP cells cultured for 20 h in medium; bottom row, DP cells stimulated by anti-CD2 and anti-TCRβ for 20 h with additional culture for 12 h in medium without antibodies. Data are representative of four separate experiments in one mouse per group. Thymocytes were obtained from CD45.2 WT, CD45.2 Themis−/−, and CD45.1 Tespa1−/− mice. d Flow cytometry analysis of thymocytes from Rag1−/− bone marrow chimeras at different stages (P1, CD69negTCRβlow; P2, CD69lowTCRβlow; P3, CD69intTCRβint; P4, CD69hiTCRβhi) defined according to CD69 and TCRβ. Staining of CD45.1 and CD45.2 in thymocytes from chimeras transferred from WT and Themis−/− bone marrrow (BM) (upper row), WT and Tespa1−/− BM (middle row), and Tespa1−/− and Themis−/− BM (bottom row). The bar graph (right) shows the quantification of the populations indicated. Data from each stage were normalized to the percentages of cells measured preinjection; n = 3 for WT and Themis−/−, n = 4 for Tespa1−/− chimeras, and n = 5 for Themis−/− and Tespa1−/− chimeras. e Calcium flux in Fluo-4 AM-labeled preselection thymocytes from WT, Themis−/−, and Tespa1−/− mice. The fluorescence intensity of Fluo-4 was normalized to the unstimulated baseline. Right, statistics for the normalized peak values of the calcium flux assays. f Phospho-flow analysis of pErk levels in WT, Themis−/−, and Tespa1−/− preselection thymocytes. Right, the quantification of pErk-positive cells. Each symbol represents an individual mouse (a, b) or a biological and technical replicate (e, f). The small horizontal lines indicate the means (±SEM); ns = not significant; *p<0.05; **p<0.01; ***p<0.0001. Student’s t test was used for a, b, and d; the Mann–Whitney test was used for e, f

