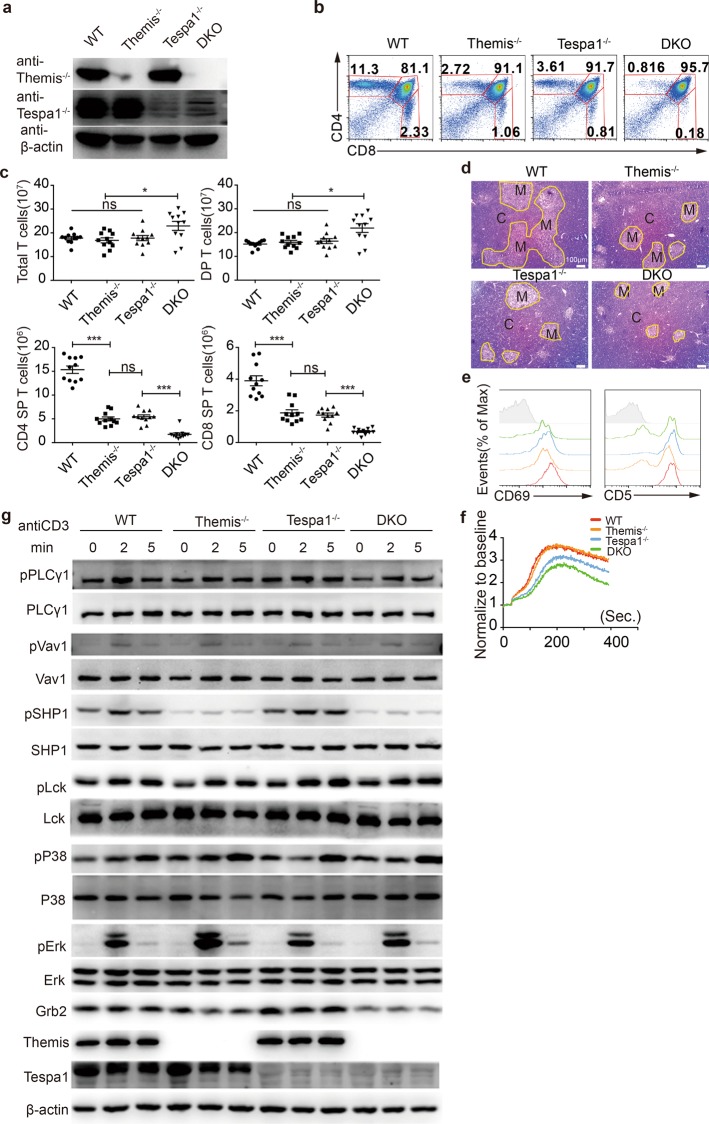
Fig. 5.
Additive impairment of thymocyte development in double knockout (DKO) mice. a Expression of Themis (thymocyte expressed positive selection associated 1) and Tespa1 (thymocyte expressed positive selection associated 1) in thymocytes from wild-type (WT), Themis−/−, Tespa1−/−, and DKO mice, as detected by immunoblot. b Flow cytometry analysis of thymocytes from WT, Themis−/−, Tespa1−/−, and DKO mice. The numbers in the outlined areas indicate the percentages of T cells in the CD4+ single positive (SP) (top left), CD8+ SP (bottom right), and double positive (DP) (top right) populations. c Quantification of the total thymocytes and of each population shown in b. d Thymus sections from WT, Themis−/−, Tespa1−/−, and DKO mice stained with hematoxylin and eosin. The medulla (M) is shown in the lighter outlined areas; the cortex (C) is represented by the darker areas; original magnification, ×100. The results are representative of two experiments. e Surface staining of CD69 and CD5 in gated DP and CD4+CD8int thymocytes from WT, Themis−/−, Tespa1−/−, and DKO mice. f Calcium flux analysis of DP thymocytes from WT, Themis−/−, Tespa1−/−, and DKO mice after stimulation with anti-CD3 and anti-CD4. g Immunoblot analysis of total and phosphorylated PLCg1, Vav1, SHP1, Lck, Erk1/2, P38, and Grb2 in sorted DP thymocytes from WT, Themis−/−, Tespa1−/−, and DKO mice stimulated by biotin anti-CD3 and streptavidin for the time indicated. Themis and Tespa1 serve as genotype markers; β-actin serves as a loading control. Data are representative of three independent experiments. Student’s t test (ns = not significant; *<0.05; ***<0.001) was used for c. The small horizontal lines indicate the means (±SEM)

