Fig. 3.
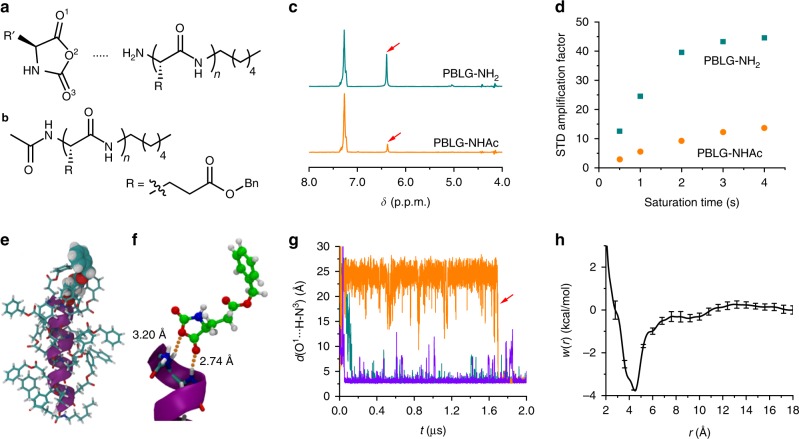
Reversible binding of polypeptide and NCA monomer. a, b Chemical structures of BLG-NCA, PBLG-NH2 a and PBLG-NHAc b. c STD NMR spectra of ELG-NCA in the presence of PBLG-NH2 or PBLG-NHAc. The STD signal of ring N‒H proton is highlighted with red arrows. The peak at 7.27 ppm is the irradiation peak since no background suppression was applied. d STD amplification factor of ring N‒H proton of ELG-NCA in the presence of PBLG-NH2 or PBLG-NHAc at various saturation times. e Snapshot of simulation trajectories showing the binding between PBLG-NH2 and BLG-NCA. The α-helical backbone is represented as a purple ribbon, the side chains of PBLG as sticks, and NCA as van der Waals spheres. f Closeup from the simulation trajectory at the N terminus of PBLG-NH2 to reveal the H-bonding interactions (highlighted with the orange dotted lines). Side chains are omitted for simplicity. g Time evolution of the H bonds formed between BLG-NCA (O1) and PBLG-NH2 (amide N–H from third residue). Each line represents one independent, 2-μs long MD simulation. The red arrow indicates the transfer of NCA from C terminus to N terminus in the third simulation run. h PMF profile for the reversible binding of PBLG-NH2 and BLG-NCA. Error bars correspond to estimated standard deviations from four independent walkers of the eABF algorithm.

