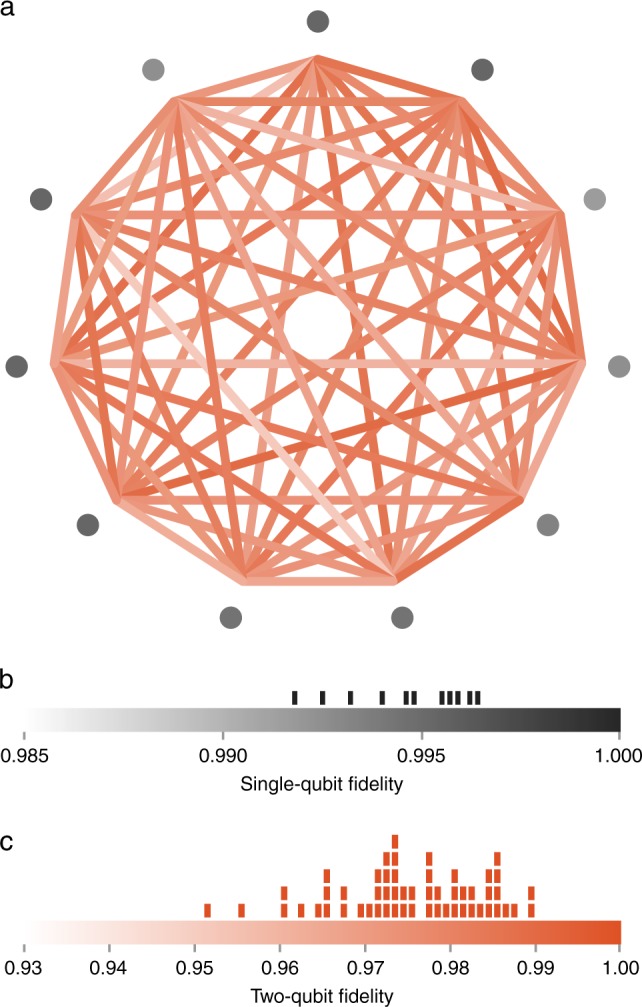
Fig. 2.

Fidelity of native gates. For each qubit pair, we perform an XX-gate and measure the joint populations of the qubit pair as a function of an analysis pulse phase angle. The fidelity of two-qubit gates are plotted as a color scale in the illustration of our all-to-all connectivity in a. For each qubit, we perform randomized benchmarking to determine the fidelity of the single-qubit gates shown in b, which are plotted as the color scale of the nodes in a. We use maximum-likelihood estimation to extract fidelities from the parity and joint-population measurement shown in c. The average two-qubit raw fidelity is 97.5% and all two-qubit gates perform in the range [95.1%, 98.9%]. The distribution of these fidelities are depicted in the histograms above the color bars shown in b, c. The fidelity of all single-qubit gates are enumerated in Supplementary Table 1 and all two-qubit pairs are enumerated in Supplementary Table 2 of the extended data.
