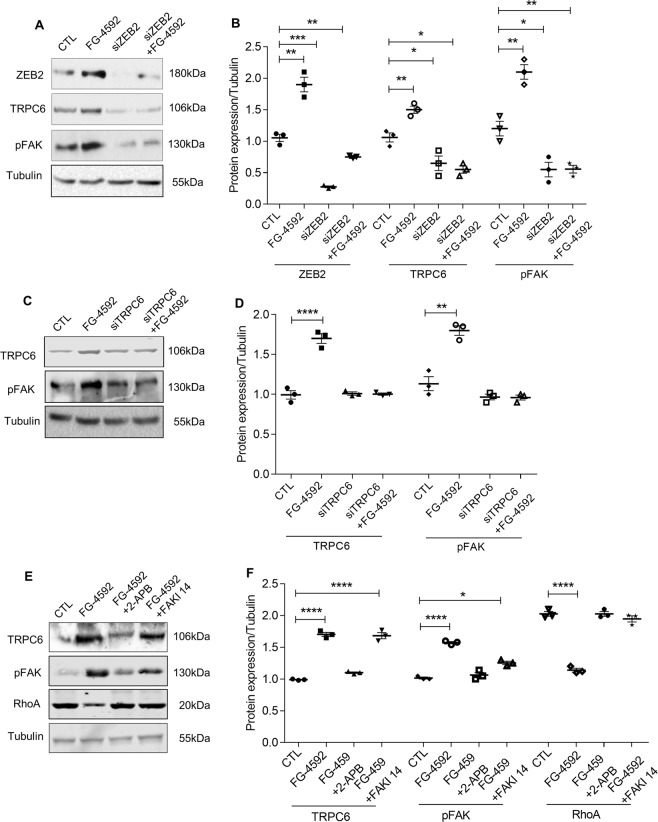
Figure 5.
Essential role of ZEB2 in regulating TRPC6 expression: (A) Immunoblotting analysis of ZEB2, TRPC6, and pFAK expression in podocytes expressing siZEB2 and treated with or without FG-4592. (B) Quantification of band intensities of ZEB2, TRPC6, pFAK was performed with ImageJ software. Error bars indicate mean ± SE; n = 3, *p < 0.01, **p < 0.008, and ***p < 0.0002. (C) Immunoblotting analysis of TRPC6 and pFAK expression in podocytes in which TRPC6 expression was knocked-down and treated with or without FG-4592. (D) Quantification of band intensities of western blots was performed with ImageJ. Error bars indicate mean ± SE; n = 3, **p < 0.008 and ****p < 0.0001. (E) Immunoblotting analysis of TRPC6, pFAK, and RhoA expression in podocytes exposed to FG-4592 and treated with or without 2APB and FAKI14. (F) Quantification of band intensities of western blots was performed with ImageJ. Error bars indicate mean ± SE; n = 3, *p < 0.01 and ****p < 0.0001.

