Figure 7.
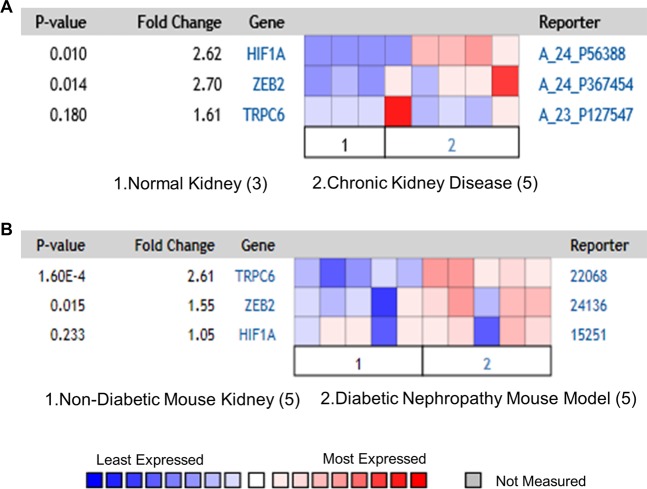
Co-expression of HIF1α, ZEB2, and TRPC6 in glomerular diseases. (A) Nakagawa CKD data set showing the elevated expression of HIF1α (2.6 fold), ZEB2 (2.7 fold), and TRPC6 (1.6 fold) in patients with chronic kidney disease vs. healthy kidney. (B) Hodgin diabetes mouse glomeruli datasets showing the elevated expression of ZEB2 (1.55 fold), and TRPC6 (2.61 fold) in mouse with diabetic nephropathy vs. non-diabetic mouse models. The data is obtained from Nephroseq (University of Michigan, Ann Arbor, MI).

