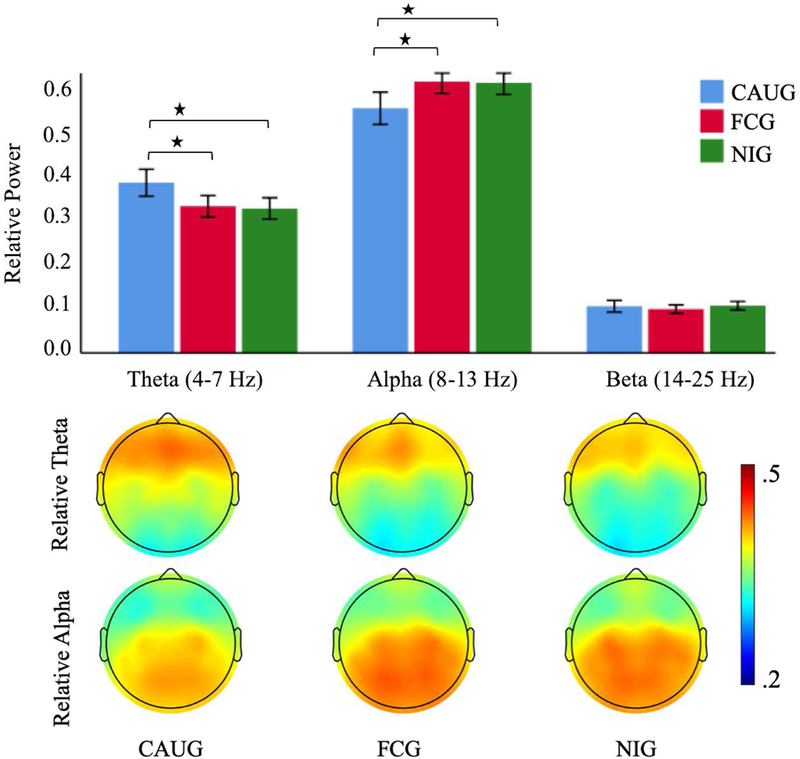
Figure. 3.

Mean relative power (top) in theta, alpha and beta frequency band for the care-as-usual group (CAUG), foster care group (FCG) and never-institutionalized group (NIG). Error bars indicate +/− 2 standard error. * p < .05. Topographic maps (bottom) display distribution of relative theta and alpha power across the scalp for the CAUG, FCG and NIG.
