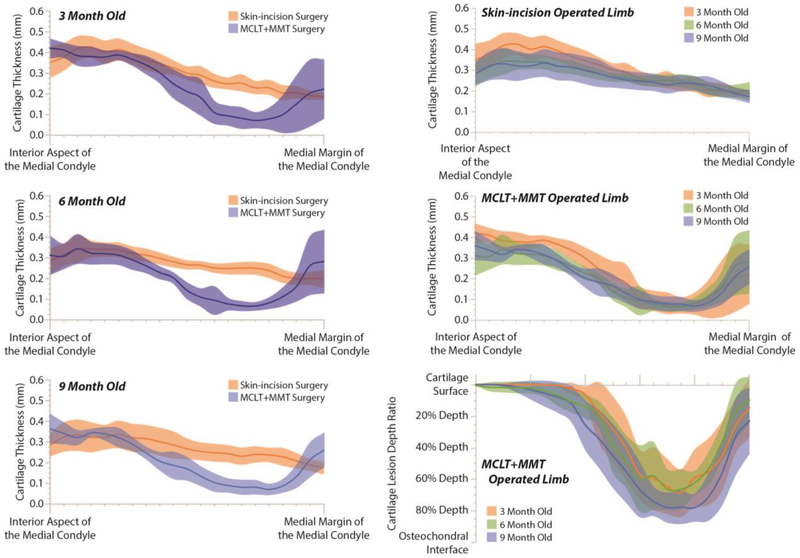
Figure 6: Cartilage Lesion Morphometry.
Like bone histomorphometery, cartilage lesion morphometry seeks to quantify lesion shape characteristics. Here, solid lines represent the average thickness or depth ratio of the cartilage, starting at the interior aspect of the medial compartment tibial plateau (left) and proceeding to the medial margin of the medial compartment tibial plateau (right); the shaded areas of like color represent a 95% confidence interval. These band are calculated at 5% steps, moving from the interior aspects of the medial condyle and proceeding to the medial margin. While these lines and bands undulate, this does not necessarily indicate the cartilage surface is rough. Instead, focal lesions or crevice-like fissures can occur in a few select samples, and this occurrence can temporarily shift the mean thickness and create an undulating average thickness. As can be seen in Column 1, cartilage thickness decreases in MCLT+MMT operated knees due to cartilage lesion formation, with the greatest losses of cartilage occurring closer to the medial margin. In Column 2, cartilage thinning is observed in skin-incision knees (Top Row). Moreover, for MCLT+MMT operated knees, the cartilage lesion appears to be wider, but not deeper, for 6 month and 9 month animals relative to 3 month old animals (Middle and Bottom Row).

