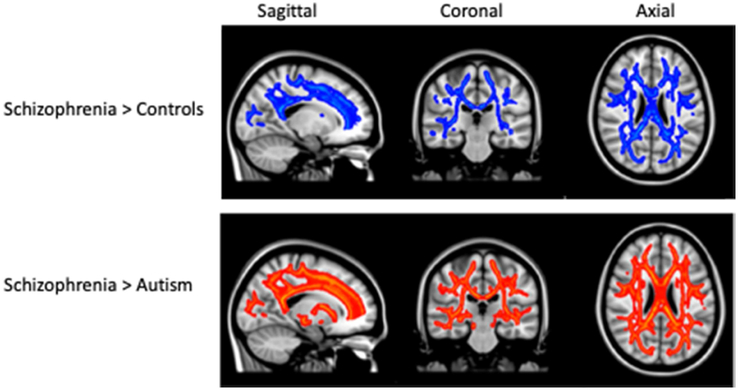
Figure 2.
White matter tracts with greater mean diffusivity in schizophrenia compared to controls (top row in blue) and compared to individuals with autism (bottom row in red), shown in sagittal, coronal, and axial slices across the brain. Differences in TFCE- selected clusters significant at p < .05 by permutation testing and, corrected for multiple comparisons. Significant clusters were inflated for illustration.

