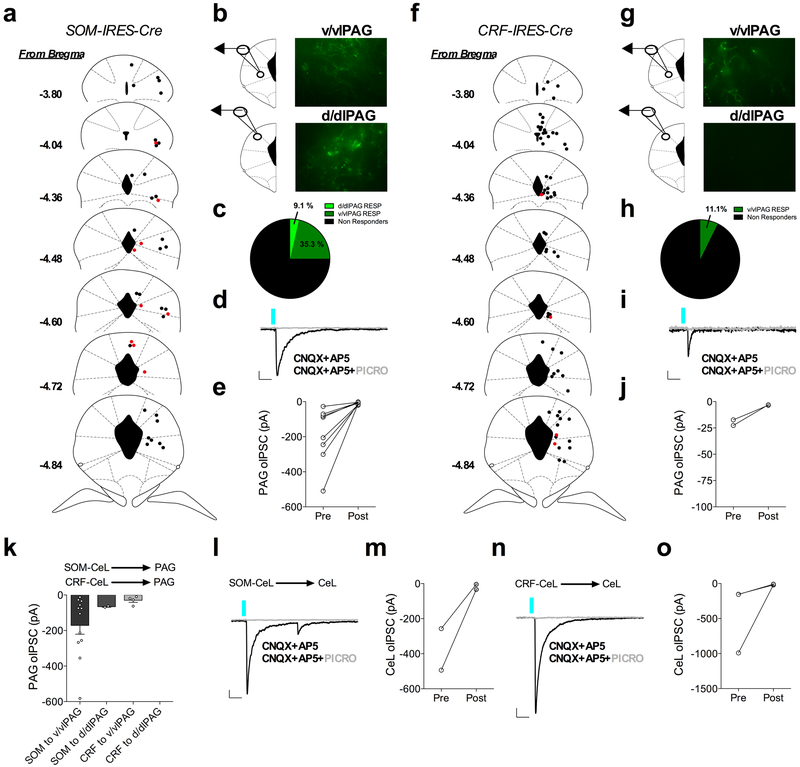
Extended Data Fig. 7. CRF+ and SOM+ neurons in the CeA signal through long-range and local GABAergic synapses to the PAG and CeL.
a, Recording sites for long-range projections of SOM+ CeA neurons to the PAG. Red dots indicate responsive neurons demonstrating oIPSCs following ChR2 stimulation of axon terminals, and black dots indicate non-responsive neurons. b, Fluorescent images taken from slice recordings demonstrating the presence of ChR2-eYFP terminals in the ventral/ventrolateral PAG and the dorsal/dorsolateral PAG; location of terminals was independently verified and repeated in n=4 mice. c, Connectivity index indicating percentage of responsive and non-responsive PAG neurons from SOM+ input (n=56 neurons, 4 mice; RESP=responsive neurons). d, Example trace of time-locked oIPSC recorded from a responsive neuron in the PAG, which was blocked following application of picrotoxin (scale bars 20ms, 20pA). e, Summary of oIPSCs blocked by picrotoxin in the PAG (n=8 neurons, 4 mice). f, Recording sites for long-range projections of CRF+ CeA neurons to the PAG. Red dots indicate responsive neurons demonstrating oIPSCs following ChR2 stimulation of axon terminals, and black dots indicate non-responsive neurons. g, Fluorescent images taken from slice recordings demonstrating the presence of ChR2-eYFP terminals in the ventral/ventrolateral PAG and lack of terminals in the dorsal/dorsolateral PAG; location of terminals was independently verified and repeated in n=4 mice. h, Connectivity index indicating percentage of responsive and non-responsive PAG neurons from CRF+ input (n=62 neurons, 4 mice; RESP=responsive neurons). i, Example trace of time-locked oIPSC recorded from a responsive neuron in the PAG, which was blocked following application of picrotoxin (scale bars 20ms, 20pA). j, Summary of oIPSCs blocked by picrotoxin in the PAG (n=2 neurons, 2 mice). k, Average amplitude of oIPSCs from SOM+ and CRF+ neuronal projections to the PAG (n=14 neurons, 4 mice for SOM+ input, n=2 neurons, 4 mice for CRF+ input). l, Example trace of time-locked oIPSC recorded from a SOM-responsive neuron in the CeL, which was blocked following application of picrotoxin (scale bars 20ms, 50pA). m, Summary of oIPSCs blocked by picrotoxin in the CeL (n=2 neurons, 2 mice). n, Example trace of time-locked oIPSC recorded from a CRF− responsive neuron in the CeL, which was blocked following application of picrotoxin (scale bars 20ms, 100pA). o, Summary of oIPSCs blocked by picrotoxin in the CeL (n=3 neurons, 3 mice). Bar graphs are presented as mean + S.E.M.

