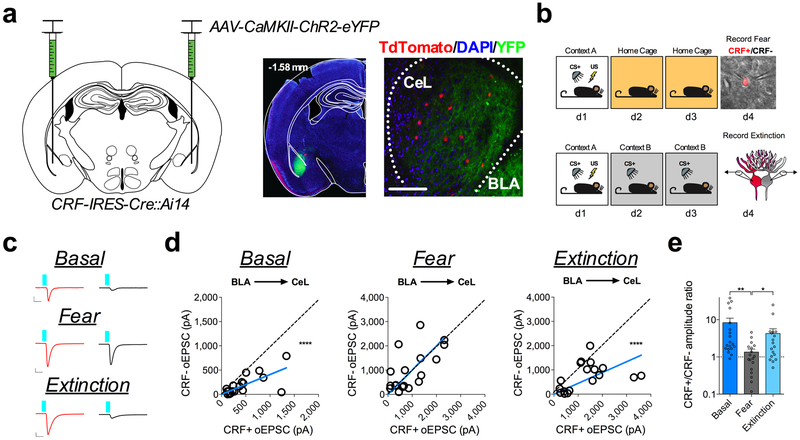
Fig. 3. Fear conditioning and extinction training bidirectionally remodel the BLA-CeL circuit input bias onto CRF+ and CRF− neurons.
a, Left: optogenetic circuit mapping approach with viral injection. Right: image of ChR2-eYFP expression in the BLA (number in top left corner depicts distance from bregma) and adjacent eYFP-positive terminals in the CeL (scale bar 150μm); location of terminals was independently verified and repeated in n=2 mice. b, Experimental paradigm for dual patch-clamp recordings from neighboring CRF+ and CRF− neurons in fear conditioned and fear extinguished mice. Bottom-right: DIC and fluorescent overlay image of dual-patch clamp recording from CRF+ and CRF− pair. c, Traces of maximal oEPSC amplitude from CRF+ (red) and CRF− (black) neuronal pairs across behavioral conditions for stimulation of the BLA-CeL circuit (scale bars 10ms, 100pA for basal, and 10ms, 400pA for fear and extinction). d, XY graphs depicting skew-plot of maximal oEPSC amplitude from each CRF+ and CRF− neuronal pair for behavioral conditions (n=19 basal pairs, 5 mice, n=18 fear pairs, 5 mice, and n=18 extinction pairs, 5 mice; extra sum-of-squares F test, F(1,18)=92.68, P<0.0001 for basal, and F(1,17)=45.08, P=0.0001 for extinction). e, Representation of CRF+/CRF− maximal oEPSC amplitude ratio (log scale; n=19 basal pairs, n=18 fear pairs, and n=18 extinction pairs; Kruskal-Wallis test, P=0.0021; post-hoc Dunn’s multiple comparisons, basal vs. fear P=0.0011, fear vs. extinction P=0.0442). XY skew-plots are presented as absolute value. Bar graphs are presented as mean + S.E.M. *P<0.05, **P<0.01, ***P<0.001, ****P<0.0001.

