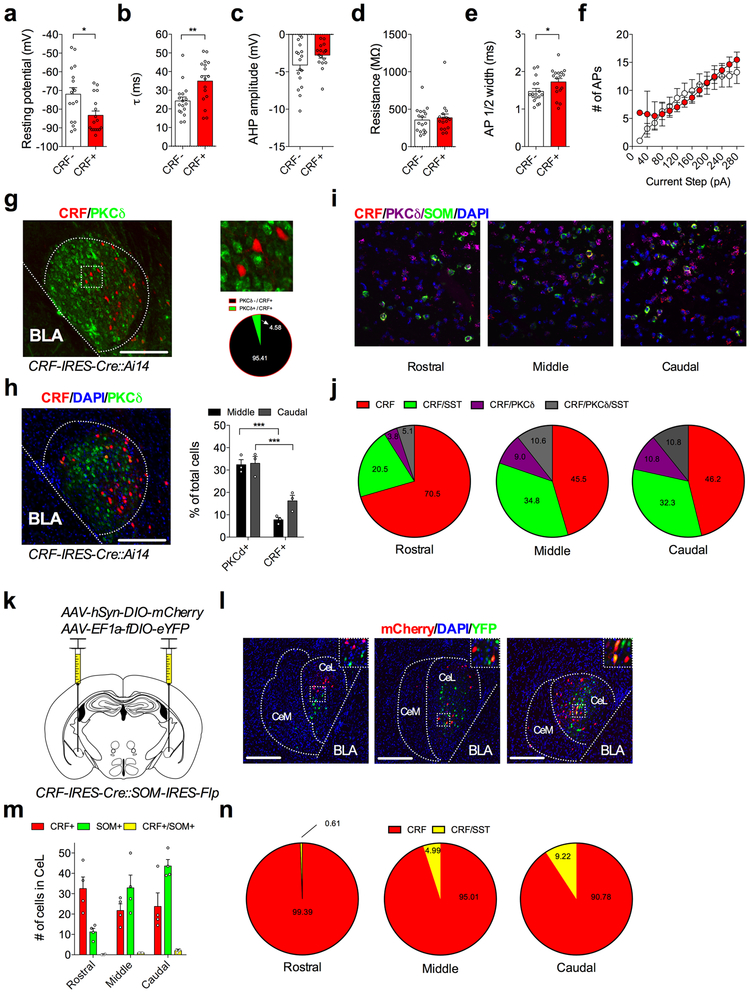
Extended Data Fig. 1. Characterization of CRF+ neurons in the CeL.
a, Resting membrane potential of neighboring CRF+ and CRF− neurons (n=17 cells per group, 4 mice; two-tailed unpaired t-test, t(32)=2.682, P=0.0115). b, Time constant of neighboring CRF+ and CRF− neurons (n=17 cells per group; two-tailed unpaired t-test, t(32)=3.025, P=0.0049). c, Afterhyperpolarization amplitude of neighboring CRF+ and CRF− neurons (n=17 cells per group). d, Input resistance of neighboring CRF+ and CRF− neurons (n=17 cells per group). e, Action potential half-width of neighboring CRF+ and CRF− neurons (n=17 cells per group; two-tailed unpaired t-test, t(32)=2.098, P=0.0439). f, Number of action potentials per current injection of neighboring CRF+ and CRF− neurons (n=17 cells per group). g, Left: image showing immunohistochemical analysis of PKCδ overlap with CRF+ neurons (scale bar 250μm). Top-right: close up inlet of image on left. Bottom-right: percentage overlap of CRF+ and PKCδ+ neurons (n=4 mice). h, Image demonstrating immunohistochemical analysis of PKCδ and CRF+ neurons in the CeA with DAPI stain for quantification of total neurons in CeL. Right: percent of PKCδ+ and CRF+ neurons in the CeL along the rostrocaudal axis (note that PKCδ staining of cell somata was absent in anterior CeL; n=3 mice; two-way ANOVA, F(1,8)=80.08, P<0.0001 for rostrocaudal axis; post-hoc Holm-Sidak’s multiple comparisons, P=0.0001 for PKCδ and P=0.0009 for CRF+). i, Images of fluorescent in situ hybridization for CRF, SOM, and PKCδ mRNA in the CeL. Images are pseudocolored for consistency with CRF+ neurons depicted as red throughout figures; in situ hybridization along the rostrocaudal axis was independently repeated in n=3 mice. j, Percentage overlap of SOM and PKCδ with CRF in the CeL along the rostrocaudal axis (n=3 mice). k, Injection strategy for targeting fluorophore expression to CRF and SOM neurons in the CeA. l, Representative images of the rostral, middle, and caudal CeA. YFP signal indicates SOM+ neurons, and mCherry signal indicates CRF+ neurons (inlet indicates either the presence or absence of co-localization between YFP and mCherry; scale bars 200μm); viral expression along the rostrocaudal axis was independently repeated in n=4 mice. m, Average quantity of CRF+, SOM+, and co-labeled CRF+/SOM+ neurons in the CeL along the rostrocaudal axis (n=4 mice). n, Average percentage of co-labeled CRF+/SOM+ neurons in the CeL along the rostrocaudal axis (n=4 mice). Action potentials per current injection are presented as mean ± S.E.M., and bar graphs are presented as mean + S.E.M. *P<0.05, **P<0.01, ***P<0.001.

