Figure 2.

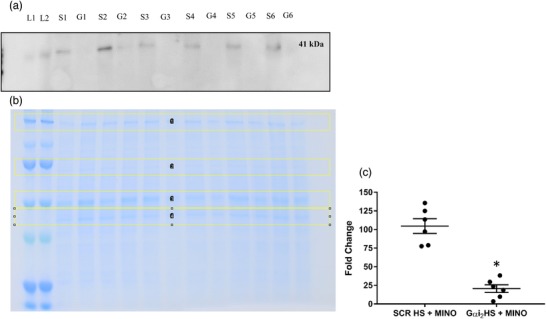
(a) Representative immunoblot demonstrating impact of Gαi2 oligodeoxynucleotide (ODN)–minocycline co‐infusion on paraventricular nucleus (PVN) Gαi2 protein expression. L1 and L2 are ladder, S1–S6 are protein extracts from the PVN of scrambled control (SCR) ODN–minocycline co‐infused animals, and G1–G6 are protein extracts from the PVN of Gαi2 ODN–minocycline co‐infused animals. (b) Representative Coomassie Blue‐stained gel demonstrating total protein loaded, and bands outlined in yellow for normalization of bands in (a). (c) Quantification of the fold change in PVN Gαi2 protein expression between SCR ODN–minocycline co‐infused animals on high salt (HS) diet (4% NaCl) and Gαi2 ODN–minocycline co‐infused animals on HS diet. (n = 6 per group, * P < 0.05 versus SCR ODN treatment group, mean ± SD.)
