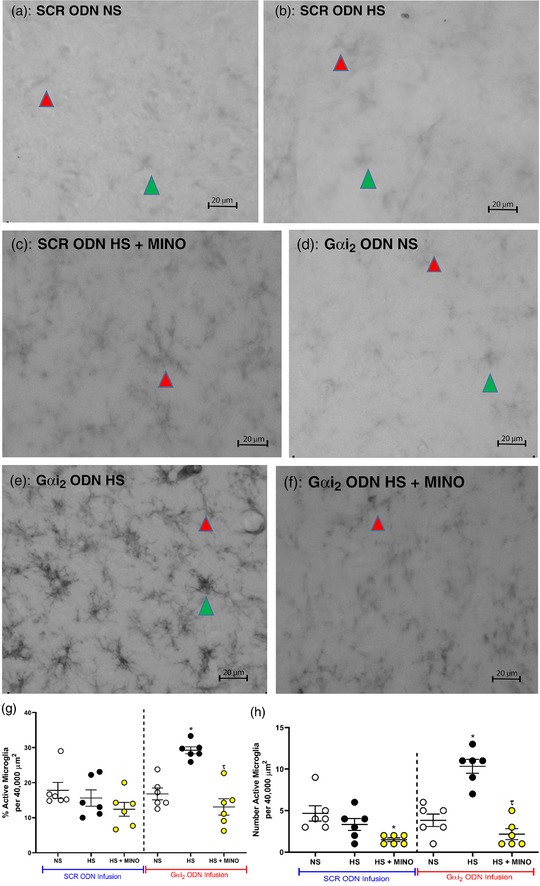
Figure 9.

Representative photomicrographs of microglia in the paraventricular nucleus (PVN) of targeted Gαi2 or control scrambled (SCR) intracerebroventricular oligodeoxynucleotide (ODN)‐infused [25 µg (5 µl)−1 day−1 for 7 days] and minocycline (MINO)–ODN co‐infused [ODN, 25 µg (5 µl)−1 day−1; MINO, 120 µg day−1 for 7 days in HS only] male Sprague–Dawley rats on 7 days of normal‐salt (NS; 0.6% NaCl) or high‐salt (HS; 4% NaCl) diet. (a) SCR ODN‐infused rat on NS diet. (b) SCR ODN‐infused rat on HS diet. (c) SCR ODN‐infused rat on HS diet co‐infused with minocycline. (d) Gαi2 ODN‐infused rat on NS diet. (e) Gαi2 ODN‐infused rat on HS diet. (f) Gαi2 ODN‐infused rat on HS diet co‐infused with minocycline. (g) Impact of minocycline co‐infusion (120 µg day−1 for 7 days) on percentage activation of PVN microglia in Sprague–Dawley rats during SCR or Gαi2 ODN infusion maintained on HS diet. (h) Impact of minocycline on number of PVN active microglia in Sprague–Dawley rats during SCR or Gαi2 ODN infusion maintained on HS diet. (n = 6 per group, scale bars: 20 µm; green arrowheads indicate representative activated microglia; red arrowheads indicates representative inactivated microglia; ×40 magnification; * P < 0.05 versus NS in respective ODN treatment group; τ P < 0.05 versus HS in respective ODN treatment group, mean ± SD.)
