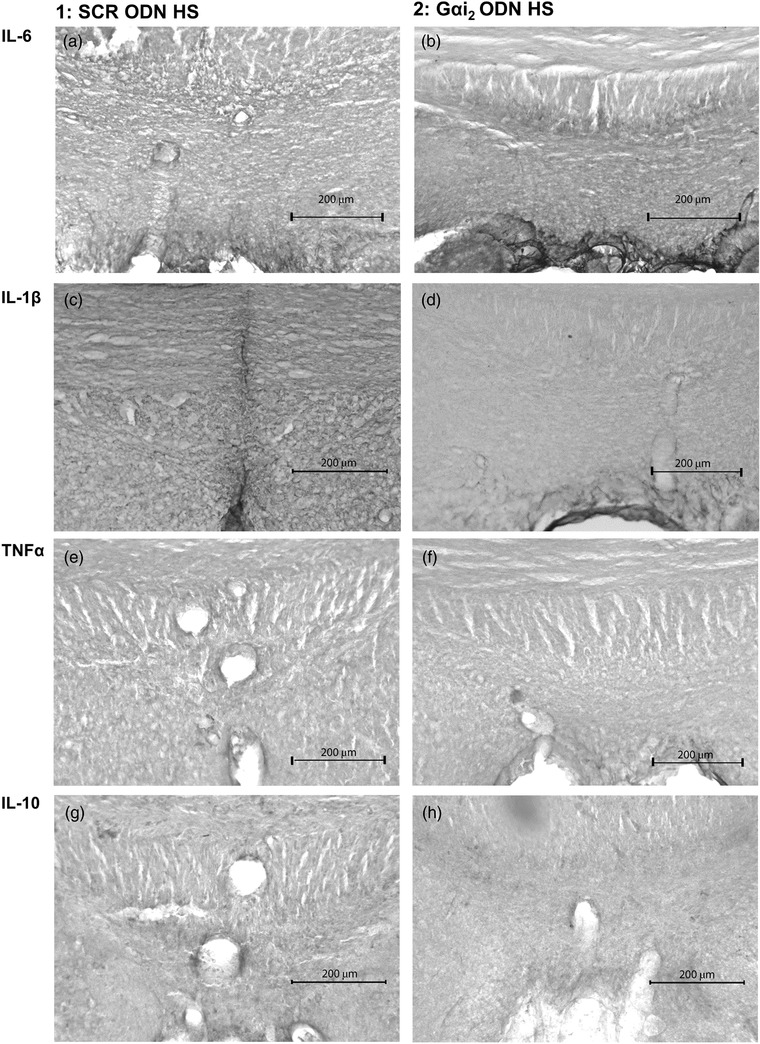
Figure 13.

Representative photomicrographs of cytokine immunoreactivity in the subfornical organ (SFO) of control scrambled (SCR; a,c,e,g) or targeted Gαi2 (b,d,f,h) intracerebroventricular oligodeoxynucleotide (ODN)‐infused [25 µg (5 µl)−1 day−1 for 7 days] male Sprague–Dawley rats on 7 days of high‐salt (HS; 4% NaCl) diet. (a,b) IL‐6 stain. (c,d) IL‐1β stain. (e,f) TNFα stain. (g,h) IL‐10 stain. (n = 6 per group, scale bar: 200 µm; ×20 magnification.)
