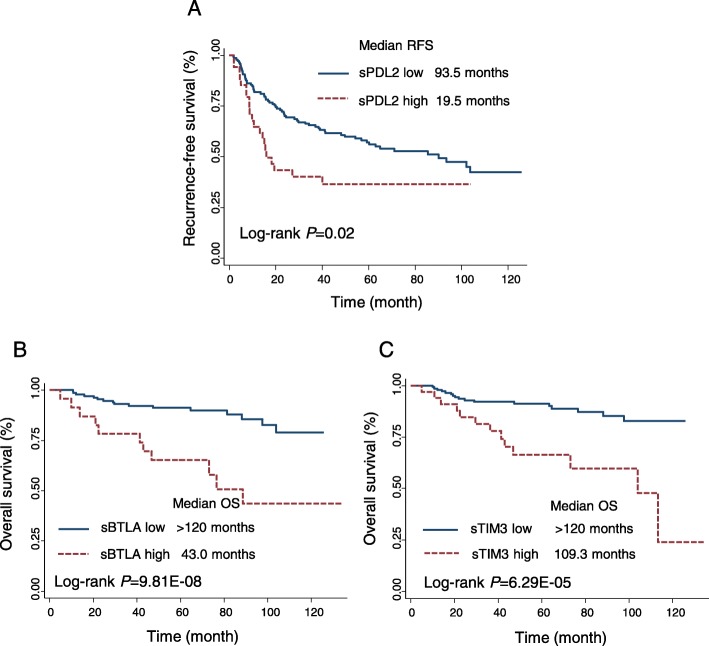
Fig. 1.
Kaplan Meier analysis of recurrence-free survival (RFS) and overall survival (OS) by levels of soluble immune checkpoint proteins in ccRCC patients. a Survival curve of RFS according to the level of sPDL2. b-c Survival curves of OS according to the levels of sBTLA, sTIM3, respectively. High- and low-level groups were dichotomized by the logistic regression spline model

