Fig. 6.
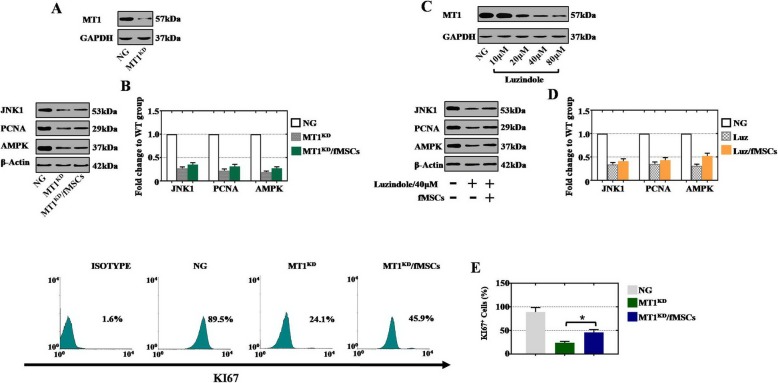
fMSCs restored POI disease by targeting MT1. a Western blot analysis of MT1 in hGCs-MT1KD cells. b Western blot analysis of JNK1, PCNA, and AMPK expression levels in different treatment groups. c Western blot assessment of MT1 after administration of the MT1 antagonist luzindole at different concentrations (10 μM, 20 μM, 40 μM, and 80 μM) in normal hGCs. d Western blot assessment of JNK1, PCNA, and AMPK in different treatment groups (luzindole, 40 μM). e KI67 expression levels were evaluated in different treatment groups by FACS. Data are represented as the mean ± SD. ***p < 0.05 (compared with the MT1KD group)

