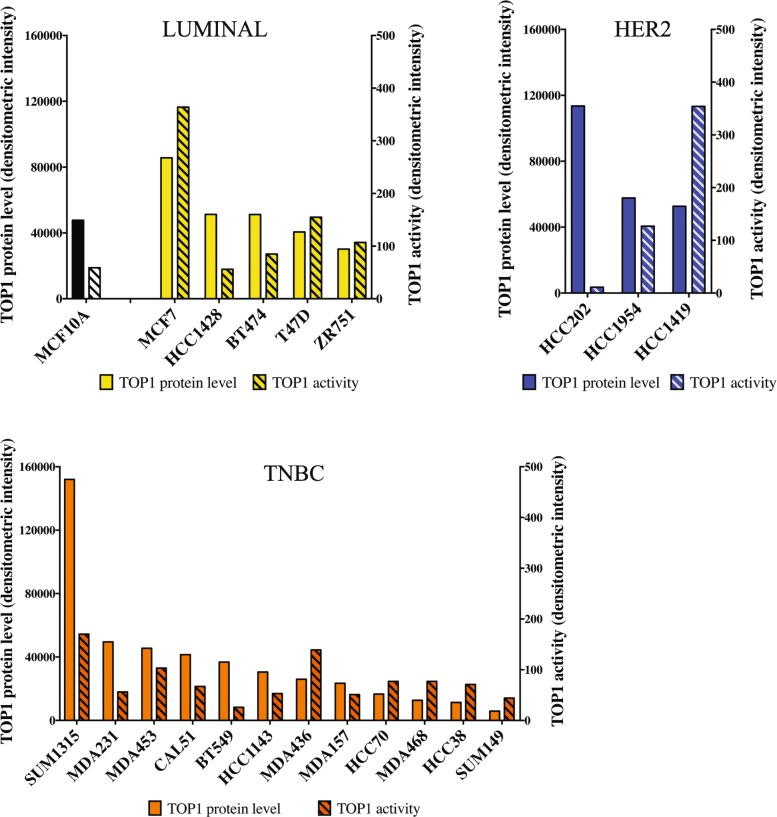
Fig. 2.
Comparative analysis of cleavage-ligation TOP1 activity and corresponding protein level. Bar-charts show TOP1 activity (lined bars) in nuclear extracts obtained from each cell line as measured by REEAD and TOP1 protein level (full bars) as determined by western blot (see Fig. 1b). TOP1 activity is shown as an average of three independent experiments. The order of cell line distribution across the “X” axis is the same as in Fig. 1. Yellow - Luminal; blue - HER2; orange - TNBC

