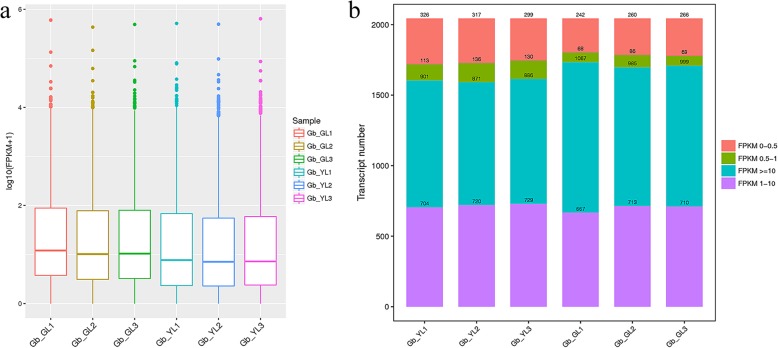
Fig. 2.
Long noncoding RNAs (lncRNAs) expression level analysis between GL and YL group in ginkgo. a Boxplot of fragments per kilobase per million reads (FPKM) values; b Transcript expression within each sample. The different colors of the FPKM expression distribution map represent different ranges of FPKM values

