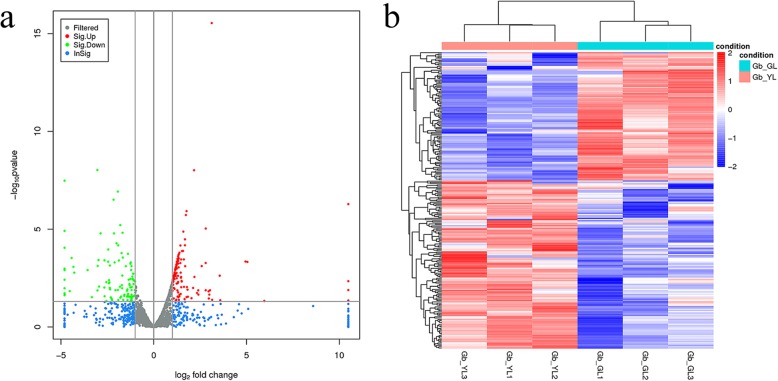
Fig. 3.
Differentially expressed lncRNAs (DELs) in ginkgo (Gb_GL and Gb_YL). a represents the differential volcano plot, the x-axis represents log2 fold change, and the y-axis represents log10 p-value. P-value < 0.05 and |log2 fold change| > 1; b Heat map clustering results of different groups. Red indicates high long noncoding RNA (lncRNA) expression, and blue indicates low lncRNA expression

