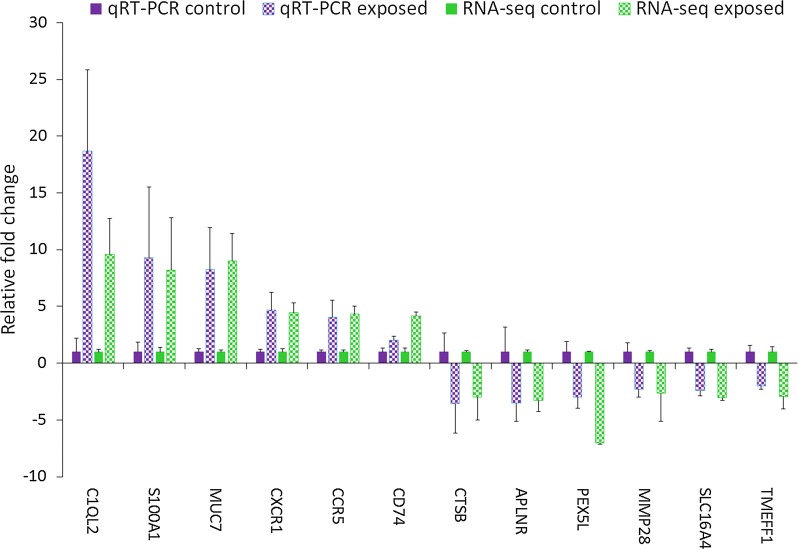
Fig. 5.
Validation of RNA-seq analysis by qRT-PCR on selected genes. The gene expression values are represented as relative fold change (mean ± SEM) of Tetracapsuloides bryosalmonae-exposed group compared to the unexposed control group (n = 6). The relative gene expression represented as the fold increase or decrease of the exposed group compared to the unexposed control group were calculated using 2−ΔΔCt method and the mean expression levels were adjusted to one

