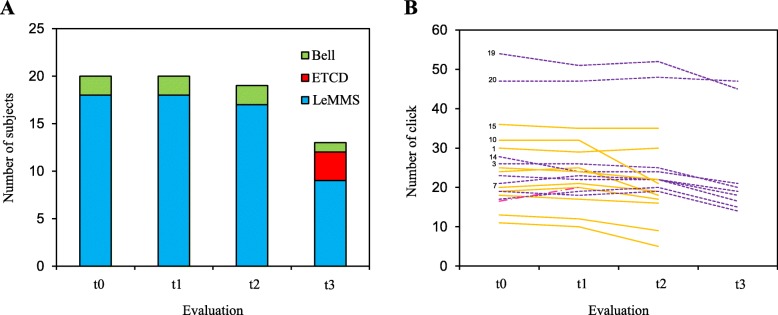
Fig. 4.
Usability of LeMMS compared to other modes of communication and PwALS’ performance on Click-Test-30 across the 12 months of the study. t0 = baseline evaluation; t1 = follow-up at 1 month; t2 = follow-up at 6 months; t3 = follow-up at 12 months. a Blue bars indicate PwALS able to use the LeMMS to communicate with scanning access. Green bars indicate PwALS able to use only an emergency Call Bell. The red bar indicates PwALS who switched from the scanning access to an ETCD. b Number of activations of the LeMMS obtained by each subject on the Click-Test-30 at the different time-points. Purple lines indicate PwALS who completed all follow-up assessments. The red line indicates the patient who dropped out between t1 and t2. Yellow lines indicate PwALS who dropped-out between t2 and t3

