Fig. 1.
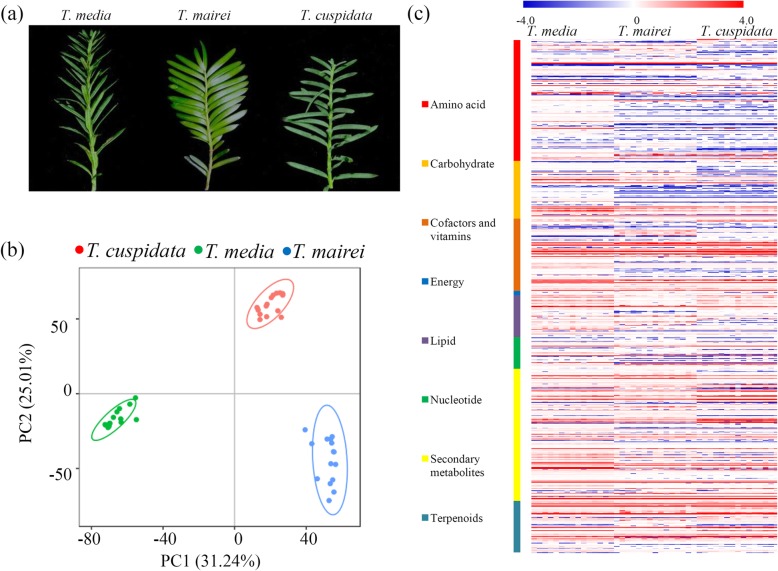
Untargeted metabolite profiling identifies the metabolites in the tested Taxus trees. a A picture of T. media, T. mairei and T. cuspidata under greenhouse condition. Fresh twigs were harvested from three cultivated Taxus species. b The PCA data of the samples from three different species. The red spots indicated the samples from T. cuspidata; the green spots indicated the samples from T. media; and the blue spots indicated the samples from T. mairei. c A heatmap of the metabolites grouped by Kyoto Encyclopedia of Genes and Genomes pathway found in the metabolomes of the three Taxus species (n = 15). The heatmap scale ranges from − 4 to + 4 on a log2 scale

