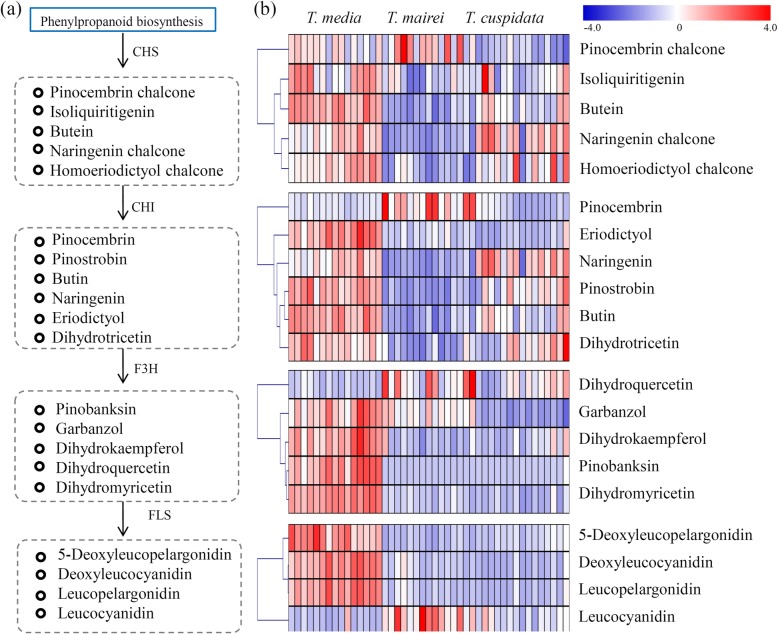
Fig. 5.
Analysis of the relative amounts of flavonoid in the Taxus metabolomes from the three different species. (a) Overview of the flavonoid biosynthesis pathway. (b) The accumulation levels of intermediate products synthesized by CHS, CHI, and F3H were showed by heatmaps. The heatmap scale ranges from -4 to +4 on a log2 scale

